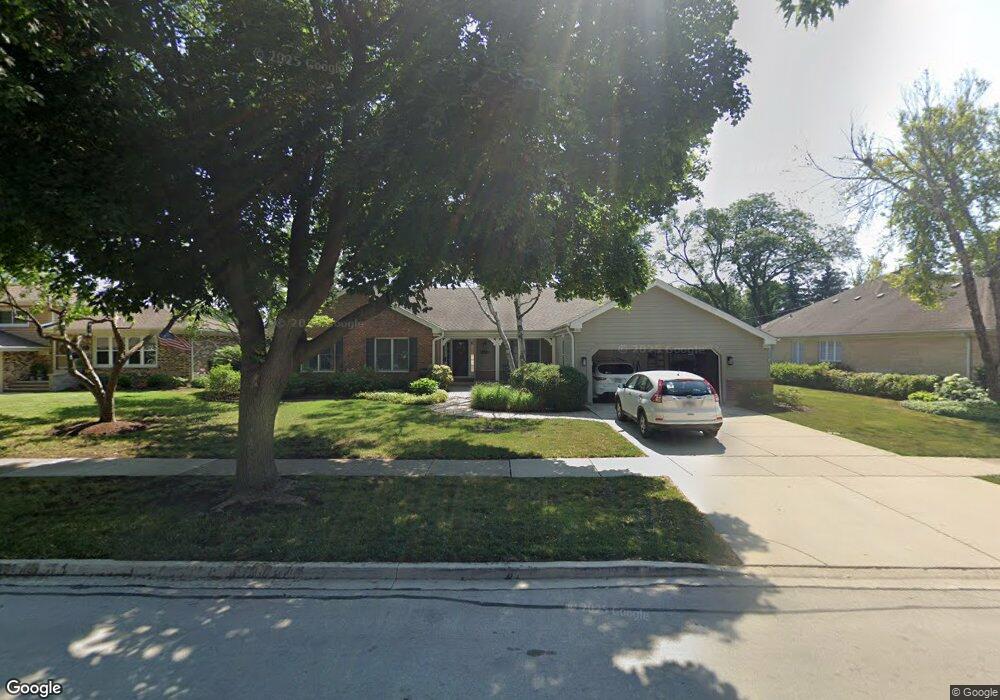
1403 N Walnut Ave Arlington Heights, IL 60004
Estimated Value: $626,366 - $776,000
4
Beds
2
Baths
2,146
Sq Ft
$314/Sq Ft
Est. Value
About This Home
This home is located at 1403 N Walnut Ave, Arlington Heights, IL 60004 and is currently estimated at $674,842, approximately $314 per square foot. 1403 N Walnut Ave is a home located in Cook County with nearby schools including Olive-Mary Stitt Elementary School, Thomas Middle School, and John Hersey High School.
Ownership History
Date
Name
Owned For
Owner Type
Purchase Details
Closed on
Feb 3, 2014
Sold by
Winter Kurt L and Winter Cara R
Bought by
Winter Cara R and Cara R Winter Revocable Trust
Current Estimated Value
Purchase Details
Closed on
Aug 15, 2003
Sold by
Mccollum Gregory P and Mccollum Sharon L
Bought by
Winter Kurt L and Cara R Winte R
Home Financials for this Owner
Home Financials are based on the most recent Mortgage that was taken out on this home.
Original Mortgage
$350,000
Outstanding Balance
$163,280
Interest Rate
6.44%
Mortgage Type
Unknown
Estimated Equity
$511,562
Purchase Details
Closed on
May 15, 1997
Sold by
Rackley James O and Rackley Diana L
Bought by
Mccollum Gregory P and Mccollum Sharon L
Home Financials for this Owner
Home Financials are based on the most recent Mortgage that was taken out on this home.
Original Mortgage
$265,500
Interest Rate
5.75%
Create a Home Valuation Report for This Property
The Home Valuation Report is an in-depth analysis detailing your home's value as well as a comparison with similar homes in the area
Home Values in the Area
Average Home Value in this Area
Purchase History
| Date | Buyer | Sale Price | Title Company |
|---|---|---|---|
| Winter Cara R | -- | None Available | |
| Winter Kurt L | $505,000 | Premier Title | |
| Mccollum Gregory P | $295,000 | -- |
Source: Public Records
Mortgage History
| Date | Status | Borrower | Loan Amount |
|---|---|---|---|
| Open | Winter Kurt L | $350,000 | |
| Previous Owner | Mccollum Gregory P | $265,500 |
Source: Public Records
Tax History Compared to Growth
Tax History
| Year | Tax Paid | Tax Assessment Tax Assessment Total Assessment is a certain percentage of the fair market value that is determined by local assessors to be the total taxable value of land and additions on the property. | Land | Improvement |
|---|---|---|---|---|
| 2024 | $10,458 | $41,518 | $11,946 | $29,572 |
| 2023 | $11,490 | $41,518 | $11,946 | $29,572 |
| 2022 | $11,490 | $47,000 | $11,946 | $35,054 |
| 2021 | $9,084 | $33,507 | $7,466 | $26,041 |
| 2020 | $8,916 | $33,507 | $7,466 | $26,041 |
| 2019 | $8,875 | $37,231 | $7,466 | $29,765 |
| 2018 | $9,394 | $35,627 | $6,570 | $29,057 |
| 2017 | $9,301 | $35,627 | $6,570 | $29,057 |
| 2016 | $8,911 | $35,627 | $6,570 | $29,057 |
| 2015 | $9,537 | $34,921 | $5,674 | $29,247 |
| 2014 | $9,274 | $34,921 | $5,674 | $29,247 |
| 2013 | $9,024 | $34,921 | $5,674 | $29,247 |
Source: Public Records
Map
Nearby Homes
- 1317 N Mitchell Ave
- 1237 N Ridge Ave
- 1142 N Mitchell Ave
- 1136 N Walnut Ave
- 1518 N Patton Ave
- 1729 N Mitchell Ave
- 1123 N Dunton Ave
- 1416 W Lynnwood Ave
- 924 N Highland Ave
- 1105 N Harvard Ave
- 910 N Chestnut Ave
- 1825 N Kaspar Ave
- 1418 W Maude Ave
- 1001 N Dunton Ave
- 1839 N Fernandez Ave
- 827 N Walnut Ave
- 25 E Palatine Rd Unit 303
- 25 E Palatine Rd Unit 207
- 1653 N Belmont Ct Unit 31
- 1605 N Chicago Ave
- 1407 N Walnut Ave
- 1339 N Walnut Ave
- 1411 N Walnut Ave
- 1406 N Mitchell Ave
- 1402 N Mitchell Ave
- 1331 N Walnut Ave
- 1410 N Mitchell Ave
- 1336 N Mitchell Ave
- 1415 N Walnut Ave
- 1404 N Walnut Ave
- 1402 N Walnut Ave
- 1408 N Walnut Ave
- 1338 N Walnut Ave
- 1414 N Mitchell Ave
- 1412 N Walnut Ave
- 1327 N Walnut Ave
- 1419 N Walnut Ave
- 1334 N Mitchell Ave
- 1334 N Walnut Ave
- 1418 N Mitchell Ave