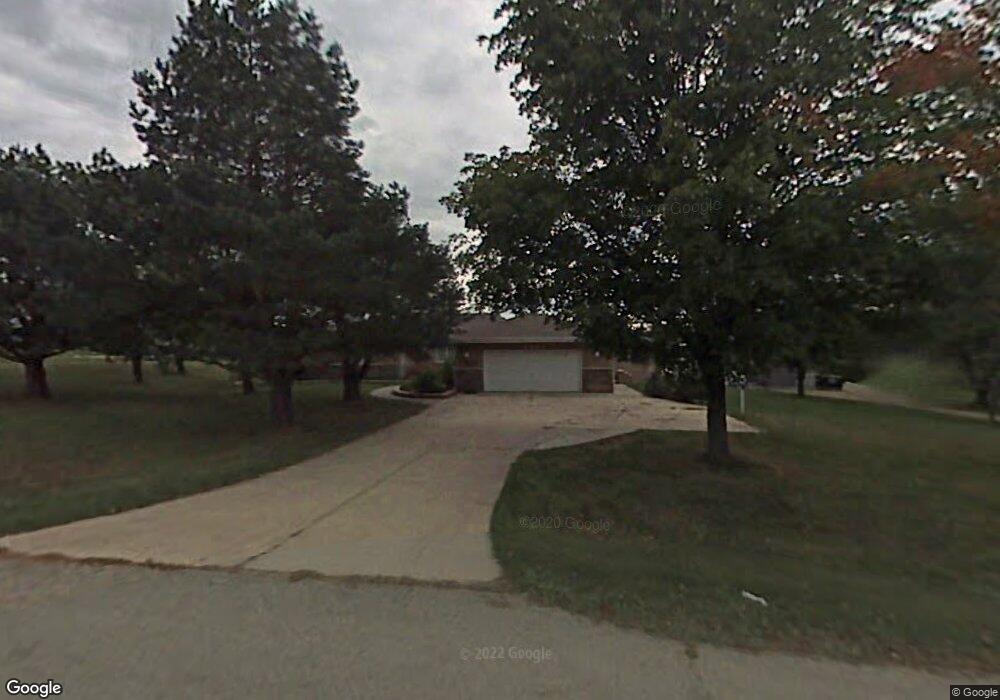
1403 Paddock Rd Spring Grove, IL 60081
Estimated Value: $416,000 - $529,000
Studio
--
Bath
2,402
Sq Ft
$192/Sq Ft
Est. Value
About This Home
This home is located at 1403 Paddock Rd, Spring Grove, IL 60081 and is currently estimated at $461,255, approximately $192 per square foot. 1403 Paddock Rd is a home located in McHenry County with nearby schools including Spring Grove Elementary School, Nippersink Middle School, and Richmond-Burton High School.
Ownership History
Date
Name
Owned For
Owner Type
Purchase Details
Closed on
Jun 24, 2021
Sold by
Shincflug Orto J
Bought by
Thelen Jessica and The Jessica Thelen Revocable T
Current Estimated Value
Home Financials for this Owner
Home Financials are based on the most recent Mortgage that was taken out on this home.
Original Mortgage
$142,000
Outstanding Balance
$128,563
Interest Rate
2.9%
Mortgage Type
New Conventional
Estimated Equity
$332,692
Purchase Details
Closed on
Mar 9, 2010
Sold by
Shineflug Judith A
Bought by
Shineflug Otto J
Home Financials for this Owner
Home Financials are based on the most recent Mortgage that was taken out on this home.
Original Mortgage
$235,257
Interest Rate
4.49%
Mortgage Type
New Conventional
Purchase Details
Closed on
Jun 15, 1994
Sold by
Gessler Richard J and Gessler Mary J
Bought by
Shineflug Otto J and Shineflug Judith A
Home Financials for this Owner
Home Financials are based on the most recent Mortgage that was taken out on this home.
Original Mortgage
$140,000
Interest Rate
8.66%
Mortgage Type
Purchase Money Mortgage
Create a Home Valuation Report for This Property
The Home Valuation Report is an in-depth analysis detailing your home's value as well as a comparison with similar homes in the area
Home Values in the Area
Average Home Value in this Area
Purchase History
| Date | Buyer | Sale Price | Title Company |
|---|---|---|---|
| Thelen Jessica | $330,000 | Chicago Title Insurance Co | |
| Shineflug Otto J | -- | None Available | |
| Shineflug Otto J | $225,000 | -- |
Source: Public Records
Mortgage History
| Date | Status | Borrower | Loan Amount |
|---|---|---|---|
| Open | Thelen Jessica | $142,000 | |
| Previous Owner | Shineflug Otto J | $235,257 | |
| Previous Owner | Shineflug Otto J | $140,000 |
Source: Public Records
Tax History
| Year | Tax Paid | Tax Assessment Tax Assessment Total Assessment is a certain percentage of the fair market value that is determined by local assessors to be the total taxable value of land and additions on the property. | Land | Improvement |
|---|---|---|---|---|
| 2024 | $9,927 | $146,124 | $26,340 | $119,784 |
| 2023 | $9,875 | $136,284 | $24,566 | $111,718 |
| 2022 | $9,295 | $119,884 | $21,610 | $98,274 |
| 2021 | $8,836 | $113,012 | $20,371 | $92,641 |
| 2020 | $8,641 | $108,031 | $19,473 | $88,558 |
| 2019 | $8,706 | $106,351 | $19,170 | $87,181 |
| 2018 | $8,898 | $103,063 | $18,577 | $84,486 |
| 2017 | $8,787 | $96,782 | $17,445 | $79,337 |
| 2016 | $8,831 | $92,428 | $16,660 | $75,768 |
| 2013 | -- | $101,258 | $19,697 | $81,561 |
Source: Public Records
Map
Nearby Homes
- 8501 Country Shire Ln
- Lot 65,66,&64 Main Street Rd
- Lot 56 & 57 Beverly Way
- Lot 58 & 59 Beverly Way
- Lot 60 & 61 Beverly Way
- 8610 Steeple Ln
- 8300 Appaloosa Ln
- 2214 Main Street Rd
- 1410 Linden Rd
- LOT 9 Mayo Ct
- 1876 Red Oak Ln
- 7830 N Pillow Hill Rd
- 1992 Red Oak Ln
- 7822 N Pillow Hill Rd
- Lot 36 Red Oak Ln
- 1852 Red Oak Ln
- 1975 Red Oak Ln
- 1979 Red Oak Ln
- 1848 Red Oak Ln
- 1971 Red Oak Ln
- 1313 Paddock Rd
- 1402 Paddock Rd
- 1409 Paddock Rd Unit 3
- 1312 Paddock Rd
- 1307 Paddock Rd
- 1415 Paddock Rd
- 1414 Paddock Rd
- 1306 Paddock Rd
- 1219 Paddock Rd
- 8316 Schmidt St
- 8509 Schmidt St
- 8514 Schmidt St
- 1218 Paddock Rd
- 8501 Schmidt St
- 8315 Sage Ln
- 1213 Paddock Rd
- 8507 Schmidt St
- 8316 Sage Ln
- 8308 Schmidt St
- 8317 Schmidt St
Your Personal Tour Guide
Ask me questions while you tour the home.