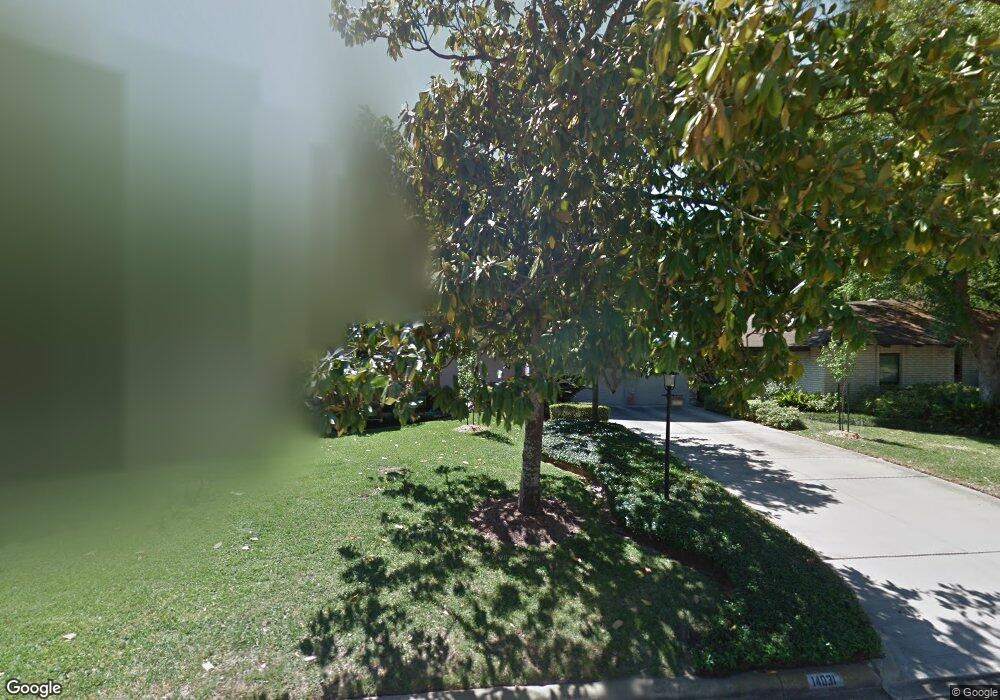
14031 Myrtlea Dr Houston, TX 77079
Energy Corridor NeighborhoodEstimated Value: $548,000 - $633,000
4
Beds
3
Baths
2,148
Sq Ft
$282/Sq Ft
Est. Value
About This Home
This home is located at 14031 Myrtlea Dr, Houston, TX 77079 and is currently estimated at $606,613, approximately $282 per square foot. 14031 Myrtlea Dr is a home located in Harris County with nearby schools including Wilchester Elementary School, Spring Forest Middle School, and Stratford High School.
Ownership History
Date
Name
Owned For
Owner Type
Purchase Details
Closed on
Jun 13, 2022
Sold by
Aziz Gulzar M and Aziz Julia J
Bought by
Lippold Sharidan S and Lippold Ryan P
Current Estimated Value
Home Financials for this Owner
Home Financials are based on the most recent Mortgage that was taken out on this home.
Original Mortgage
$350,000
Outstanding Balance
$332,968
Interest Rate
5.25%
Mortgage Type
New Conventional
Estimated Equity
$273,645
Purchase Details
Closed on
Mar 30, 2007
Sold by
Cheetham John Anthony
Bought by
Cheetham Mary W
Purchase Details
Closed on
Dec 18, 2006
Sold by
Aziz Gulzar M
Bought by
Aziz Julia J
Purchase Details
Closed on
Jul 20, 2004
Sold by
Max Judy L and Starling Judith M
Bought by
Aziz Gulzar M
Home Financials for this Owner
Home Financials are based on the most recent Mortgage that was taken out on this home.
Original Mortgage
$61,000
Interest Rate
6.32%
Mortgage Type
Purchase Money Mortgage
Create a Home Valuation Report for This Property
The Home Valuation Report is an in-depth analysis detailing your home's value as well as a comparison with similar homes in the area
Home Values in the Area
Average Home Value in this Area
Purchase History
| Date | Buyer | Sale Price | Title Company |
|---|---|---|---|
| Lippold Sharidan S | -- | Charter Title Company | |
| Cheetham Mary W | -- | None Available | |
| Aziz Julia J | -- | American Title Co | |
| Aziz Gulzar M | -- | Chicago Title |
Source: Public Records
Mortgage History
| Date | Status | Borrower | Loan Amount |
|---|---|---|---|
| Open | Lippold Sharidan S | $350,000 | |
| Previous Owner | Aziz Gulzar M | $61,000 |
Source: Public Records
Tax History Compared to Growth
Tax History
| Year | Tax Paid | Tax Assessment Tax Assessment Total Assessment is a certain percentage of the fair market value that is determined by local assessors to be the total taxable value of land and additions on the property. | Land | Improvement |
|---|---|---|---|---|
| 2025 | $10,679 | $486,351 | $365,075 | $121,276 |
| 2024 | $10,679 | $484,460 | $365,075 | $119,385 |
| 2023 | $10,679 | $521,250 | $365,075 | $156,175 |
| 2022 | $10,360 | $443,118 | $328,568 | $114,550 |
| 2021 | $10,222 | $438,000 | $306,663 | $131,337 |
| 2020 | $9,537 | $380,624 | $306,663 | $73,961 |
| 2019 | $10,472 | $400,000 | $306,663 | $93,337 |
| 2018 | $1,819 | $385,800 | $306,663 | $79,137 |
| 2017 | $10,334 | $395,000 | $306,663 | $88,337 |
| 2016 | $9,652 | $403,400 | $306,663 | $96,737 |
| 2015 | $1,568 | $431,901 | $306,663 | $125,238 |
| 2014 | $1,568 | $373,822 | $262,854 | $110,968 |
Source: Public Records
Map
Nearby Homes
- 14122 Barryknoll Ln
- 14123 Misty Meadow Ln
- 13931 Kingsride Ln
- 14143 Lost Meadow Ln
- 14151 Lost Meadow Ln
- 14171 Misty Meadow Ln
- 14226 Misty Meadow Ln
- 14228 Misty Meadow Ln
- 14213 Lost Meadow Ln
- 14135 Kimberley Ln
- 14325 Lost Meadow Ln
- 14311 Misty Meadow Ln
- 14322 Misty Meadow Ln
- 1334 Country Place Dr
- 14387 Misty Meadow Ln
- 1310 Country Place Dr
- 807 Patchester Dr
- 14407 Still Meadow Dr
- 1071 Country Place Dr Unit 1071
- 1381 Country Place Dr Unit 23
- 14027 Myrtlea Dr
- 14035 Myrtlea Dr
- 14030 Kingsride Ln
- 14023 Myrtlea Dr
- 14039 Myrtlea Dr
- 14022 Kingsride Ln
- 14034 Kingsride Ln
- 14034 Myrtlea Dr
- 14030 Myrtlea Dr
- 14038 Myrtlea Dr
- 14018 Kingsride Ln
- 14019 Myrtlea Dr
- 14103 Myrtlea Dr
- 14026 Myrtlea Dr
- 14102 Kingsride Ln
- 14102 Myrtlea Dr
- 14014 Kingsride Ln
- 14022 Myrtlea Dr
- 14015 Myrtlea Dr
- 14106 Kingsride Ln