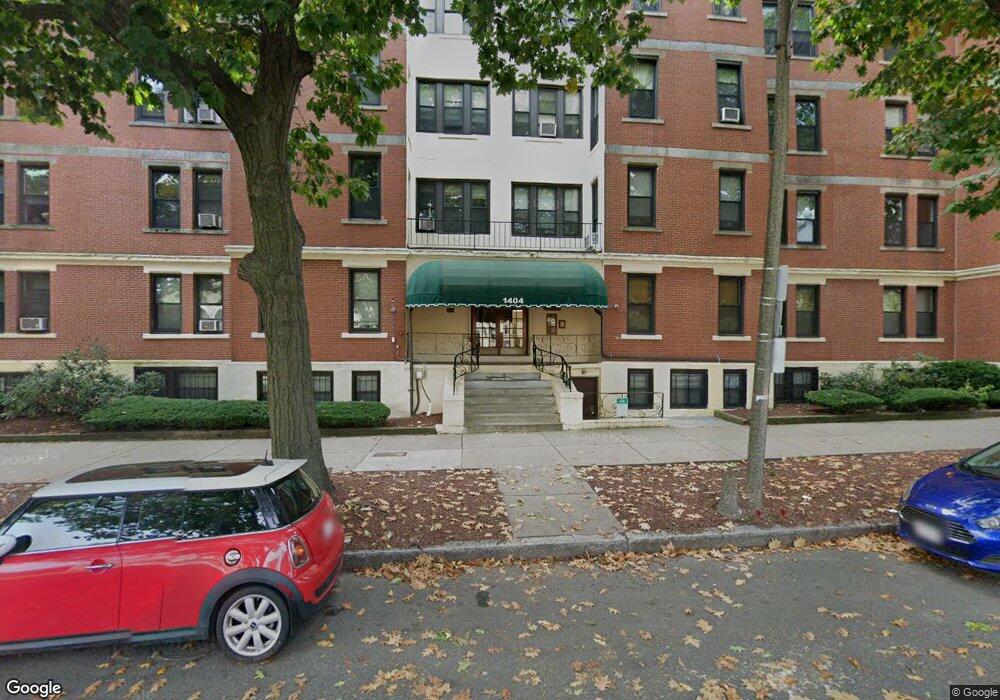
1404 Commonwealth Ave Unit 20 Brighton, MA 02135
Commonwealth NeighborhoodEstimated Value: $421,000 - $447,205
1
Bed
1
Bath
645
Sq Ft
$675/Sq Ft
Est. Value
About This Home
This home is located at 1404 Commonwealth Ave Unit 20, Brighton, MA 02135 and is currently estimated at $435,301, approximately $674 per square foot. 1404 Commonwealth Ave Unit 20 is a home located in Suffolk County with nearby schools including Boston Green Academy Horace Mann Charter School, St Columbkille Partnership School, and Mesivta High School of Greater Boston.
Ownership History
Date
Name
Owned For
Owner Type
Purchase Details
Closed on
Dec 9, 2022
Sold by
Nguyen Hang and Tran Catherine
Bought by
Salim Panirwala K
Current Estimated Value
Home Financials for this Owner
Home Financials are based on the most recent Mortgage that was taken out on this home.
Original Mortgage
$393,300
Outstanding Balance
$381,004
Interest Rate
7.08%
Mortgage Type
Purchase Money Mortgage
Estimated Equity
$54,297
Purchase Details
Closed on
Aug 7, 1998
Sold by
Cavanaugh Hugh and Cavanaugh Katherine
Bought by
Markiewicz Kira
Home Financials for this Owner
Home Financials are based on the most recent Mortgage that was taken out on this home.
Original Mortgage
$76,500
Interest Rate
6.92%
Mortgage Type
Purchase Money Mortgage
Create a Home Valuation Report for This Property
The Home Valuation Report is an in-depth analysis detailing your home's value as well as a comparison with similar homes in the area
Home Values in the Area
Average Home Value in this Area
Purchase History
| Date | Buyer | Sale Price | Title Company |
|---|---|---|---|
| Salim Panirwala K | $414,000 | None Available | |
| Markiewicz Kira | $85,000 | -- | |
| Markiewicz Kira | $85,000 | -- |
Source: Public Records
Mortgage History
| Date | Status | Borrower | Loan Amount |
|---|---|---|---|
| Open | Salim Panirwala K | $393,300 | |
| Previous Owner | Markiewicz Kira | $152,000 | |
| Previous Owner | Markiewicz Kira | $76,500 |
Source: Public Records
Tax History Compared to Growth
Tax History
| Year | Tax Paid | Tax Assessment Tax Assessment Total Assessment is a certain percentage of the fair market value that is determined by local assessors to be the total taxable value of land and additions on the property. | Land | Improvement |
|---|---|---|---|---|
| 2025 | $4,699 | $405,800 | $0 | $405,800 |
| 2024 | $4,102 | $376,300 | $0 | $376,300 |
| 2023 | $3,554 | $330,900 | $0 | $330,900 |
| 2022 | $3,397 | $312,200 | $0 | $312,200 |
| 2021 | $3,331 | $312,200 | $0 | $312,200 |
| 2020 | $3,256 | $308,300 | $0 | $308,300 |
| 2019 | $3,186 | $302,300 | $0 | $302,300 |
| 2018 | $2,962 | $282,600 | $0 | $282,600 |
| 2017 | $2,771 | $261,700 | $0 | $261,700 |
| 2016 | $2,641 | $240,100 | $0 | $240,100 |
| 2015 | $2,565 | $211,800 | $0 | $211,800 |
| 2014 | $2,422 | $192,500 | $0 | $192,500 |
Source: Public Records
Map
Nearby Homes
- 159-161 Allston
- 1408 Commonwealth Ave Unit 20
- 130 Glenville Ave
- 147 Kelton St Unit 305
- 1419 Commonwealth Ave Unit 503
- 198 Allston St Unit 3
- 86 Glenville Ave Unit 2
- 239 Kelton St Unit 41
- 245 Kelton St Unit 21
- 85 Brainerd Rd Unit TH7
- 15 Commonwealth Ct Unit 10
- 83 Glenville Ave
- 1304 Commonwealth Ave Unit 5
- 1515 Commonwealth Ave Unit 405
- 1515 Commonwealth Ave Unit 303
- 1515 Commonwealth Ave Unit 311
- 1515 Commonwealth Ave Unit 514
- 2 Bed + Den 2 Bath Plan at 1515 Comm Ave
- 2 Bed 2 Bath Plan at 1515 Comm Ave
- 3 Bed 2 Bath Plan at 1515 Comm Ave
- 1404 Commonwealth Ave Unit 6
- 1404 Commonwealth Ave Unit 8
- 1404 Commonwealth Ave Unit 21
- 1404 Commonwealth Ave Unit 19
- 1404 Commonwealth Ave Unit 18
- 1404 Commonwealth Ave Unit 17
- 1404 Commonwealth Ave Unit 16
- 1404 Commonwealth Ave Unit 15
- 1404 Commonwealth Ave Unit 14
- 1404 Commonwealth Ave Unit 12
- 1404 Commonwealth Ave Unit 11
- 1404 Commonwealth Ave Unit 10
- 1404 Commonwealth Ave Unit 9
- 1404 Commonwealth Ave Unit 8
- 1404 Commonwealth Ave Unit 7
- 1404 Commonwealth Ave Unit 6
- 1404 Commonwealth Ave Unit 5
- 1404 Commonwealth Ave Unit 3
- 1404 Commonwealth Ave Unit 2
- 1404 Commonwealth Ave Unit 1