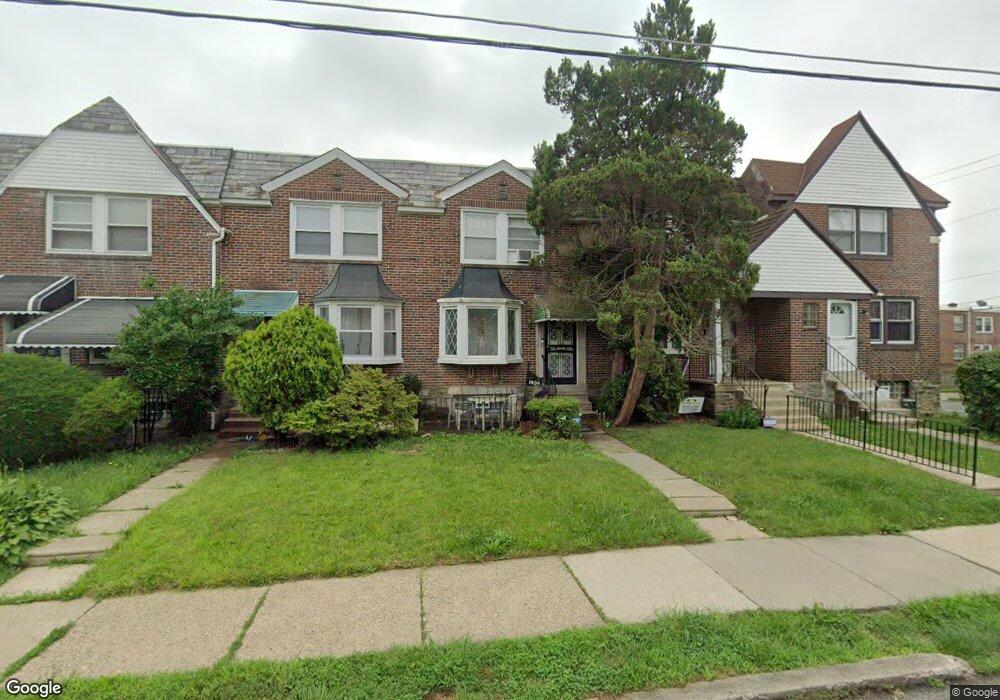
1404 E Sharpnack St Philadelphia, PA 19150
West Oak Lane NeighborhoodEstimated Value: $194,000 - $294,000
3
Beds
1
Bath
1,090
Sq Ft
$212/Sq Ft
Est. Value
About This Home
This home is located at 1404 E Sharpnack St, Philadelphia, PA 19150 and is currently estimated at $230,900, approximately $211 per square foot. 1404 E Sharpnack St is a home located in Philadelphia County with nearby schools including Franklin S Edmonds School, Martin Luther King High School, and St. Raymond Of Penafort Catholic School.
Ownership History
Date
Name
Owned For
Owner Type
Purchase Details
Closed on
Jul 9, 2009
Sold by
Harmon Bydeia S
Bought by
Hymes Patricia L
Current Estimated Value
Home Financials for this Owner
Home Financials are based on the most recent Mortgage that was taken out on this home.
Original Mortgage
$134,971
Outstanding Balance
$87,730
Interest Rate
5.31%
Mortgage Type
FHA
Estimated Equity
$143,170
Purchase Details
Closed on
Aug 11, 2008
Sold by
Cook Robert W
Bought by
Harmon Bydeia S
Home Financials for this Owner
Home Financials are based on the most recent Mortgage that was taken out on this home.
Original Mortgage
$101,600
Interest Rate
6.4%
Mortgage Type
Purchase Money Mortgage
Purchase Details
Closed on
Oct 25, 2007
Sold by
Lee Laverne A and Lee Lawrence A
Bought by
Cook Robert W
Purchase Details
Closed on
Nov 13, 2002
Sold by
Lee Laverne A
Bought by
Lee Laverne A and Lee Lawrence A
Create a Home Valuation Report for This Property
The Home Valuation Report is an in-depth analysis detailing your home's value as well as a comparison with similar homes in the area
Home Values in the Area
Average Home Value in this Area
Purchase History
| Date | Buyer | Sale Price | Title Company |
|---|---|---|---|
| Hymes Patricia L | $137,500 | Stewart Title Guaranty Co | |
| Harmon Bydeia S | $127,000 | None Available | |
| Cook Robert W | $75,000 | None Available | |
| Lee Laverne A | -- | -- |
Source: Public Records
Mortgage History
| Date | Status | Borrower | Loan Amount |
|---|---|---|---|
| Open | Hymes Patricia L | $134,971 | |
| Previous Owner | Harmon Bydeia S | $101,600 |
Source: Public Records
Tax History
| Year | Tax Paid | Tax Assessment Tax Assessment Total Assessment is a certain percentage of the fair market value that is determined by local assessors to be the total taxable value of land and additions on the property. | Land | Improvement |
|---|---|---|---|---|
| 2026 | $2,179 | $196,100 | $39,220 | $156,880 |
| 2025 | $2,179 | $196,100 | $39,220 | $156,880 |
| 2024 | $2,179 | $196,100 | $39,220 | $156,880 |
| 2023 | $2,179 | $155,700 | $31,140 | $124,560 |
| 2022 | $1,572 | $155,700 | $31,140 | $124,560 |
| 2021 | $1,572 | $0 | $0 | $0 |
| 2020 | $1,572 | $0 | $0 | $0 |
| 2019 | $1,642 | $0 | $0 | $0 |
| 2017 | $1,922 | $0 | $0 | $0 |
Source: Public Records
Map
Nearby Homes
- 1409 E Weaver St
- 7732 Temple Rd
- 7823 Forrest Ave
- 7828 Michener Ave
- 7832 Michener Ave
- 7856 Provident St
- 7837 Provident St
- 7728 Thouron Ave
- 7736 Gilbert St
- 2461 79th Ave
- 7643 Gilbert St
- 7807 Rugby St
- 7554 Forrest Ave
- 7701 Rugby St
- 7975 Provident St
- 7705 Pickering Ave
- 8016 Williams Ave
- 2472 00 76th Ave
- 7538 Forrest Ave
- 7818 Cedarbrook Ave
- 1402 E Sharpnack St
- 1406 E Sharpnack St
- 1408 E Sharpnack St
- 1400 E Sharpnack St
- 1410 E Sharpnack St
- 1412 E Sharpnack St
- 1403 Weaver St
- 1409 Weaver St
- 1414 E Sharpnack St
- 1405 Weaver St
- 1407 Weaver St
- 1401 Weaver St
- 1403 E Weaver St
- 1411 Weaver St
- 1411 E Weaver St
- 1413 Weaver St
- 1416 E Sharpnack St
- 1415 Weaver St
- 7801 Williams Ave
- 1417 Weaver St
Your Personal Tour Guide
Ask me questions while you tour the home.