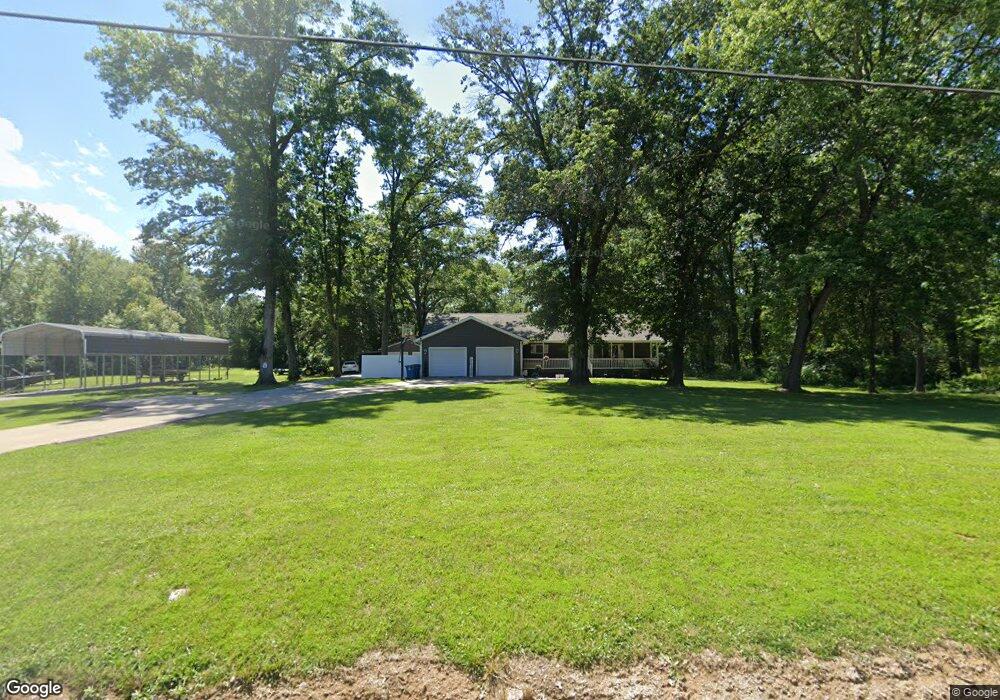
14041 N Link Ln Mount Vernon, IL 62864
Estimated Value: $230,000 - $302,133
3
Beds
2
Baths
2,314
Sq Ft
$120/Sq Ft
Est. Value
About This Home
This home is located at 14041 N Link Ln, Mount Vernon, IL 62864 and is currently estimated at $277,533, approximately $119 per square foot. 14041 N Link Ln is a home located in Jefferson County with nearby schools including Summersville Grade School, Mount Vernon High School, and St Marys.
Ownership History
Date
Name
Owned For
Owner Type
Purchase Details
Closed on
Jun 27, 2025
Sold by
Rogers Wesley N
Bought by
Ballard Mark J and Ballard Lana K
Current Estimated Value
Home Financials for this Owner
Home Financials are based on the most recent Mortgage that was taken out on this home.
Original Mortgage
$295,000
Outstanding Balance
$294,501
Interest Rate
6.86%
Mortgage Type
New Conventional
Estimated Equity
-$16,968
Purchase Details
Closed on
Oct 15, 2019
Sold by
Rogers Heather
Bought by
Rogers Wesley N
Purchase Details
Closed on
Jul 19, 2011
Sold by
Terry Barbara Sue
Bought by
Shaner Jared Damion and Shaner Erinne Elizabeth
Home Financials for this Owner
Home Financials are based on the most recent Mortgage that was taken out on this home.
Original Mortgage
$172,000
Interest Rate
4.52%
Mortgage Type
New Conventional
Purchase Details
Closed on
Oct 20, 2006
Sold by
Phillips Robert J and Phillips Christine
Bought by
Terry Richard L and Terry Barbara Sue
Create a Home Valuation Report for This Property
The Home Valuation Report is an in-depth analysis detailing your home's value as well as a comparison with similar homes in the area
Home Values in the Area
Average Home Value in this Area
Purchase History
| Date | Buyer | Sale Price | Title Company |
|---|---|---|---|
| Ballard Mark J | $350,000 | None Listed On Document | |
| Rogers Wesley N | -- | -- | |
| Shaner Jared Damion | $172,000 | None Available | |
| Terry Richard L | $175,000 | None Available |
Source: Public Records
Mortgage History
| Date | Status | Borrower | Loan Amount |
|---|---|---|---|
| Open | Ballard Mark J | $295,000 | |
| Previous Owner | Shaner Jared Damion | $172,000 |
Source: Public Records
Tax History Compared to Growth
Tax History
| Year | Tax Paid | Tax Assessment Tax Assessment Total Assessment is a certain percentage of the fair market value that is determined by local assessors to be the total taxable value of land and additions on the property. | Land | Improvement |
|---|---|---|---|---|
| 2024 | $5,103 | $80,187 | $3,427 | $76,760 |
| 2023 | $4,857 | $74,028 | $3,164 | $70,864 |
| 2022 | $4,801 | $64,936 | $2,775 | $62,161 |
| 2021 | $4,646 | $61,844 | $2,643 | $59,201 |
| 2020 | $4,625 | $57,798 | $2,470 | $55,328 |
| 2019 | $4,575 | $57,798 | $2,470 | $55,328 |
| 2018 | $4,511 | $57,798 | $2,470 | $55,328 |
| 2017 | $4,425 | $57,798 | $2,470 | $55,328 |
| 2016 | $4,331 | $57,798 | $2,470 | $55,328 |
| 2015 | $4,258 | $57,798 | $2,470 | $55,328 |
| 2014 | $3,097 | $57,798 | $2,470 | $55,328 |
| 2013 | $3,097 | $54,526 | $2,330 | $52,196 |
Source: Public Records
Map
Nearby Homes
- 14063 N Link Ln
- 909 & 905 Fairfield Rd
- 820 White Ave
- 717 White Ave
- 14013 N Tolle Ln
- 14009 N Tolle Ln
- 820 Airport Rd
- 601 Marteeny St
- 415 Marteeny St
- 1300 N Tolle Ln
- 14625 Illinois 15
- 14322 N Memory Ln
- 14560 E Loyola Rd
- 213 S 2nd St
- 14017 E Eastland Rd
- 408 N 6th St
- 704 Royal Ave
- 300 S 4th St
- 317 N 7th St
- 704 N 8th St
- 14058 N Link Ln
- 14036 N Link Ln
- 14062 N Link Ln
- 14069 N Link Ln
- 14027 N Link Ln
- 14020 N Link Ln
- 14070 N Link Ln
- 14070 N Link Rd
- 14077 N Link Ln
- 13995 N Link Ln
- 14028 N Link Ln
- 14085 N Link Ln
- 14040 N Link Ln
- 14000 N Link Ln
- 14076 N Link Ln
- 807 Fairfield Rd
- 807 Fairfield Rd
- 801 E Fairfield Rd
- 801 Old Fairfield Rd
- 821 E Fairfield Rd