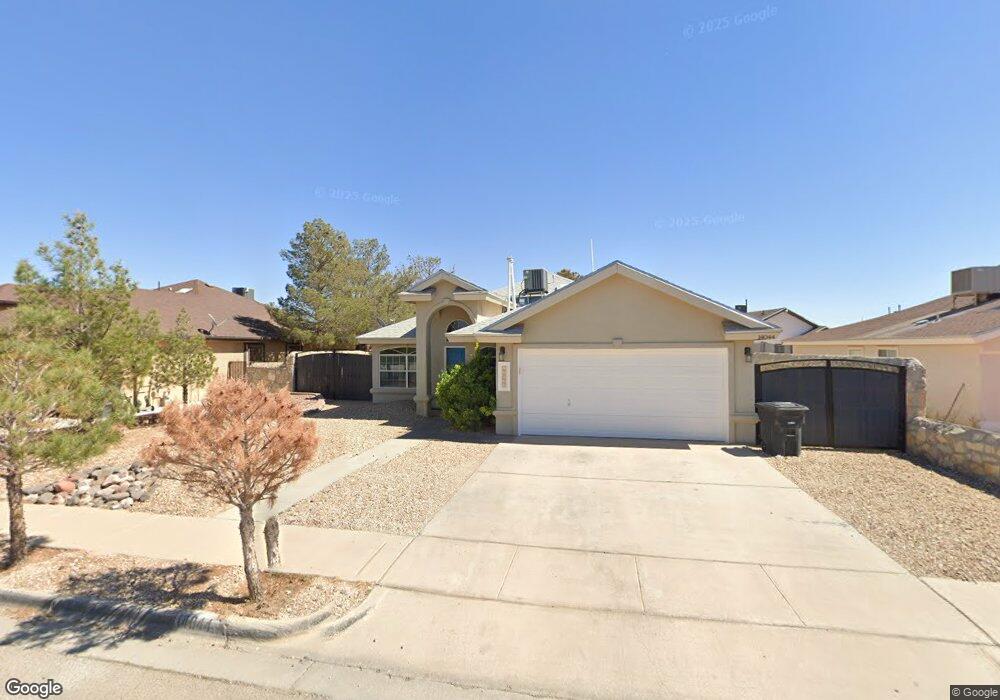
14044 Lago Azul St Horizon City, TX 79928
Estimated Value: $198,000 - $218,777
3
Beds
2
Baths
1,540
Sq Ft
$134/Sq Ft
Est. Value
About This Home
This home is located at 14044 Lago Azul St, Horizon City, TX 79928 and is currently estimated at $206,694, approximately $134 per square foot. 14044 Lago Azul St is a home located in El Paso County with nearby schools including Desert Hills Elementary School, Horizon Middle School, and Horizon High School.
Ownership History
Date
Name
Owned For
Owner Type
Purchase Details
Closed on
Nov 5, 2015
Sold by
Zamora David R and Hernandez Zamora S
Bought by
Cardenas Jorge and Macias Jessica
Current Estimated Value
Purchase Details
Closed on
Jul 30, 2007
Sold by
Hobson Johnny Walter
Bought by
Zamora David R
Home Financials for this Owner
Home Financials are based on the most recent Mortgage that was taken out on this home.
Original Mortgage
$110,000
Interest Rate
6.69%
Mortgage Type
Purchase Money Mortgage
Purchase Details
Closed on
Dec 31, 2003
Sold by
Carefree Homes I Lp
Bought by
Hobson Johnny Walter
Home Financials for this Owner
Home Financials are based on the most recent Mortgage that was taken out on this home.
Original Mortgage
$86,355
Interest Rate
8.62%
Mortgage Type
Purchase Money Mortgage
Create a Home Valuation Report for This Property
The Home Valuation Report is an in-depth analysis detailing your home's value as well as a comparison with similar homes in the area
Home Values in the Area
Average Home Value in this Area
Purchase History
| Date | Buyer | Sale Price | Title Company |
|---|---|---|---|
| Cardenas Jorge | -- | -- | |
| Zamora David R | -- | Sierra | |
| Hobson Johnny Walter | -- | -- |
Source: Public Records
Mortgage History
| Date | Status | Borrower | Loan Amount |
|---|---|---|---|
| Previous Owner | Zamora David R | $110,000 | |
| Previous Owner | Hobson Johnny Walter | $86,355 | |
| Closed | Cardenas Jorge | $0 |
Source: Public Records
Tax History Compared to Growth
Tax History
| Year | Tax Paid | Tax Assessment Tax Assessment Total Assessment is a certain percentage of the fair market value that is determined by local assessors to be the total taxable value of land and additions on the property. | Land | Improvement |
|---|---|---|---|---|
| 2025 | $7,070 | $220,173 | $17,721 | $202,452 |
| 2024 | $7,070 | $220,173 | $17,721 | $202,452 |
| 2023 | $6,820 | $215,674 | $17,721 | $197,953 |
| 2022 | $5,693 | $175,593 | $17,721 | $157,872 |
| 2021 | $5,667 | $158,821 | $17,721 | $141,100 |
| 2020 | $4,295 | $123,643 | $17,721 | $105,922 |
| 2018 | $4,058 | $120,918 | $17,721 | $103,197 |
| 2017 | $3,763 | $113,324 | $17,721 | $95,603 |
| 2016 | $3,763 | $113,324 | $17,721 | $95,603 |
| 2015 | $3,379 | $113,324 | $17,721 | $95,603 |
| 2014 | $3,379 | $113,996 | $17,721 | $96,275 |
Source: Public Records
Map
Nearby Homes
- 14156 Warren Belin Dr
- 317 Jim Knowles Place
- 14005 Lago Azul St
- 475 N Kenazo Ave
- 467 N Kenazo Ave
- 14052 Highweed Dr
- 156 Lago Grande Dr
- 14032 Highweed Dr
- 13977 Veny Webb St
- 14117 Highweed Dr
- 14100 Ghost Flower St
- 409 Desert Chicory St
- TBD Rodman St
- 0 Highweed Dr Unit 918787
- 394 Brill Cir
- 441 Desert Dandelion St
- 150 Rodman
- PN-31080 Tbd
- 444 Ghost Flower St
- 390 Medill Place
- 14044 Lago Azul St Unit 2
- 14040 Lago Azul St
- 14048 Lago Azul St
- 14048 Lago Azul St Unit 2
- 229 Lago Grande Dr
- 229 Lago Grande Dr Unit 2
- 233 Lago Grande Dr Unit 2
- 14052 Lago Azul St
- 14036 Lago Azul St
- 14036 Lago Azul St Unit 2
- 225 Lago Grande Dr
- 14045 Lago Azul St
- 14045 Lago Azul St Unit 2
- 14045 Lago Azul St
- 237 Lago Grande Dr
- 237 Lago Grande Dr Unit 2
- 14041 Lago Azul St
- 14041 Lago Azul St Unit 2
- 14049 Lago Azul St
- 14049 Lago Azul St Unit 2