Estimated Value: $217,533 - $252,000
2
Beds
1
Bath
1,424
Sq Ft
$163/Sq Ft
Est. Value
About This Home
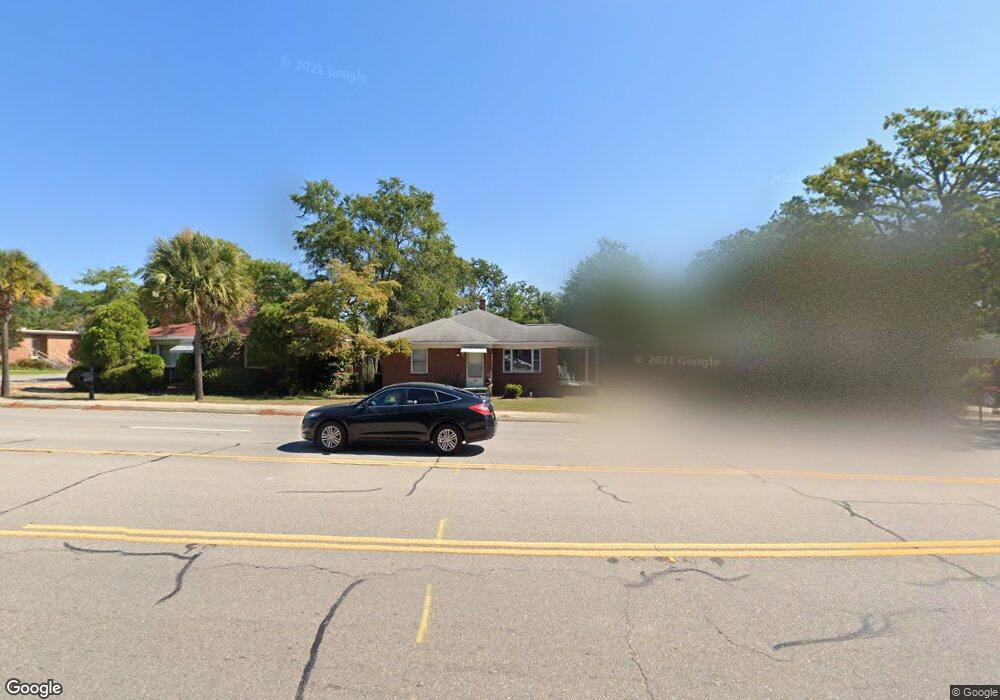
This home is located at 1405 12th St, Cayce, SC 29033 and is currently estimated at $232,383, approximately $163 per square foot. 1405 12th St is a home located in Lexington County with nearby schools including Cayce Elementary, Cyril B. Busbee Creative Arts Academy, and Brookland-Cayce High School.
Ownership History
Date
Name
Owned For
Owner Type
Purchase Details
Closed on
Jun 26, 2023
Sold by
Catfish Properties Llc
Bought by
Wyss Victoria G
Current Estimated Value
Home Financials for this Owner
Home Financials are based on the most recent Mortgage that was taken out on this home.
Original Mortgage
$150,300
Outstanding Balance
$146,412
Interest Rate
6.35%
Mortgage Type
New Conventional
Estimated Equity
$85,971
Purchase Details
Closed on
Jul 2, 2018
Sold by
Savage Jason C
Bought by
Catfish Properties Llc
Purchase Details
Closed on
Dec 17, 2012
Sold by
Swygert Properties Three Llc
Bought by
Savage Jason C
Home Financials for this Owner
Home Financials are based on the most recent Mortgage that was taken out on this home.
Original Mortgage
$100,000
Interest Rate
3.43%
Mortgage Type
Future Advance Clause Open End Mortgage
Purchase Details
Closed on
May 27, 2011
Sold by
Swygert Junius B
Bought by
Swygert Properties Three Llc
Create a Home Valuation Report for This Property
The Home Valuation Report is an in-depth analysis detailing your home's value as well as a comparison with similar homes in the area
Home Values in the Area
Average Home Value in this Area
Purchase History
| Date | Buyer | Sale Price | Title Company |
|---|---|---|---|
| Wyss Victoria G | $167,000 | None Listed On Document | |
| Catfish Properties Llc | -- | None Available | |
| Savage Jason C | $100,000 | -- | |
| Swygert Properties Three Llc | -- | -- |
Source: Public Records
Mortgage History
| Date | Status | Borrower | Loan Amount |
|---|---|---|---|
| Open | Wyss Victoria G | $150,300 | |
| Closed | Wyss Victoria G | $8,000 | |
| Previous Owner | Savage Jason C | $100,000 |
Source: Public Records
Tax History
| Year | Tax Paid | Tax Assessment Tax Assessment Total Assessment is a certain percentage of the fair market value that is determined by local assessors to be the total taxable value of land and additions on the property. | Land | Improvement |
|---|---|---|---|---|
| 2024 | $1,159 | $6,680 | $1,600 | $5,080 |
| 2023 | $1,205 | $7,210 | $2,100 | $5,110 |
| 2022 | $2,488 | $7,210 | $2,100 | $5,110 |
| 2020 | $2,472 | $7,210 | $2,100 | $5,110 |
| 2019 | $2,383 | $6,878 | $2,160 | $4,718 |
| 2018 | $2,336 | $6,878 | $2,160 | $4,718 |
| 2017 | $2,300 | $6,878 | $2,160 | $4,718 |
| 2016 | $2,313 | $6,878 | $2,160 | $4,718 |
| 2014 | $1,732 | $5,999 | $2,160 | $3,839 |
| 2013 | -- | $6,000 | $2,160 | $3,840 |
Source: Public Records
Map
Nearby Homes
- 1015 Naples Ave
- 1407 Karlaney Ave
- 900 Michaelmas (Aka "M" Ave) Ave
- 1804 13th St
- 900 Naples Ave
- TBD Poplar Lots A B & C St
- 0 Lot 7 Poplar St
- 827 Indigo Ave
- 1224 Evergreen Ave
- 1011 D Ave
- 762 Poplar St
- 754 Poplar St
- 746 Poplar St
- 822 Lexington Ave
- 0 Poplar St Unit Lot 1 598703
- 611 Naples Ave
- 1610 D Ave
- Oak Plan at Faith Hills
- 707 Holland Ave
- Tract 1 Hallelujah Rd
- 1401 12th St
- 1409 12th St
- 1129 Karlaney Ave
- 1136 Lafayette Ave
- 1118 Lafayette Ave
- 1125 Karlaney Ave
- 1414 12th St
- 1400 12th St
- 1416 12th St
- 1140 Karlaney Ave
- 1116 Lafayette Ave
- 1422 12th St
- 1320 12th St
- 1116 Karlaney Ave
- 1105 Karlaney Ave
- 1501 12th St
- 1201 Karlaney Ave
- 1312 12th St
- 1114 Lafayette Ave
- 1210 Lafayette Ave
Your Personal Tour Guide
Ask me questions while you tour the home.