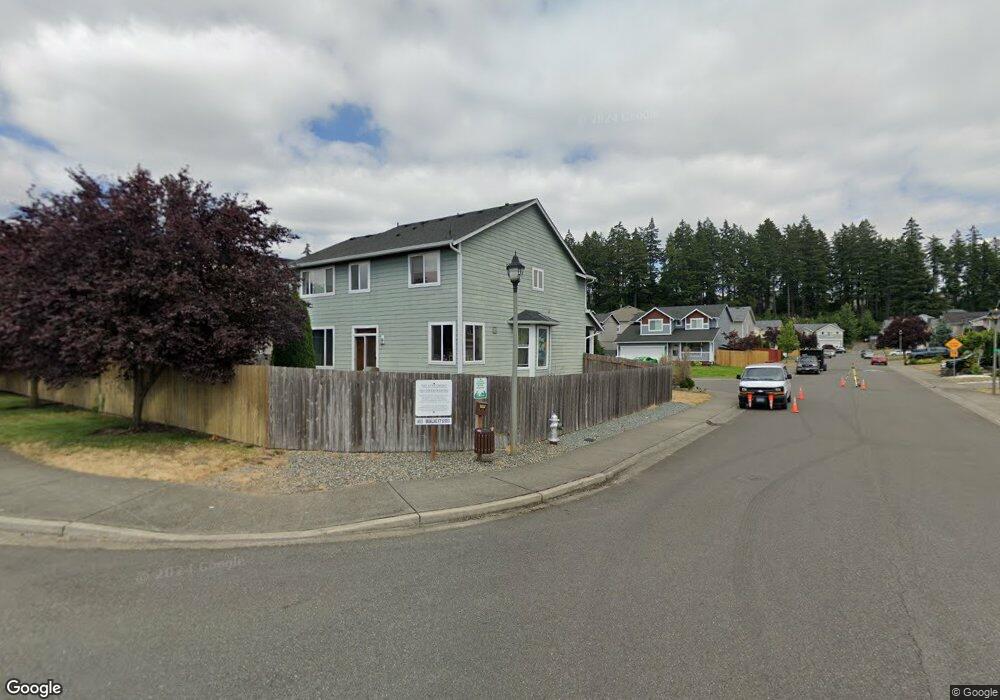
1405 202nd Stct E Spanaway, WA 98387
Estimated Value: $504,000 - $516,000
4
Beds
3
Baths
2,087
Sq Ft
$244/Sq Ft
Est. Value
About This Home
This home is located at 1405 202nd Stct E, Spanaway, WA 98387 and is currently estimated at $509,816, approximately $244 per square foot. 1405 202nd Stct E is a home located in Pierce County with nearby schools including Shining Mountain Elementary School, Bethel Middle School, and Bethel High School.
Ownership History
Date
Name
Owned For
Owner Type
Purchase Details
Closed on
Oct 11, 2012
Sold by
Suncrest Builders Inc
Bought by
Jobe Adam A
Current Estimated Value
Home Financials for this Owner
Home Financials are based on the most recent Mortgage that was taken out on this home.
Original Mortgage
$224,678
Outstanding Balance
$156,094
Interest Rate
3.58%
Mortgage Type
VA
Estimated Equity
$353,722
Purchase Details
Closed on
May 25, 2011
Sold by
Carriage House Development Inc
Bought by
Suncrest Builders Inc
Purchase Details
Closed on
Jul 28, 2010
Sold by
Umpqua Bank
Bought by
Carriage House Development Inc
Home Financials for this Owner
Home Financials are based on the most recent Mortgage that was taken out on this home.
Original Mortgage
$186,000
Interest Rate
4.71%
Mortgage Type
Purchase Money Mortgage
Purchase Details
Closed on
Sep 10, 2009
Sold by
Boardwalk Homes Inc
Bought by
Rainier Pacific Bank
Create a Home Valuation Report for This Property
The Home Valuation Report is an in-depth analysis detailing your home's value as well as a comparison with similar homes in the area
Home Values in the Area
Average Home Value in this Area
Purchase History
| Date | Buyer | Sale Price | Title Company |
|---|---|---|---|
| Jobe Adam A | $219,950 | Fidelity National Title | |
| Suncrest Builders Inc | $156,000 | Fidelity Natl Title Ins Co | |
| Carriage House Development Inc | $183,000 | Fatco | |
| Rainier Pacific Bank | $1,500,000 | Fatco |
Source: Public Records
Mortgage History
| Date | Status | Borrower | Loan Amount |
|---|---|---|---|
| Open | Jobe Adam A | $224,678 | |
| Previous Owner | Carriage House Development Inc | $186,000 |
Source: Public Records
Tax History
| Year | Tax Paid | Tax Assessment Tax Assessment Total Assessment is a certain percentage of the fair market value that is determined by local assessors to be the total taxable value of land and additions on the property. | Land | Improvement |
|---|---|---|---|---|
| 2025 | $5,268 | $485,700 | $151,900 | $333,800 |
| 2024 | $5,268 | $477,100 | $147,400 | $329,700 |
| 2023 | $5,268 | $451,500 | $151,900 | $299,600 |
| 2022 | $5,021 | $469,700 | $144,100 | $325,600 |
| 2021 | $4,682 | $332,800 | $95,100 | $237,700 |
| 2019 | $3,277 | $303,700 | $82,900 | $220,800 |
| 2018 | $4,026 | $268,400 | $75,200 | $193,200 |
| 2017 | $3,643 | $260,200 | $66,300 | $193,900 |
| 2016 | $3,463 | $223,000 | $50,600 | $172,400 |
| 2014 | $3,034 | $207,100 | $48,600 | $158,500 |
| 2013 | $3,034 | $188,300 | $41,900 | $146,400 |
Source: Public Records
Map
Nearby Homes
- 1221 201st Street Ct E
- 20402 15th Avenue Ct E
- 1609 200th Street Ct E
- 20208 17th Avenue Ct E
- 1524 199th St E
- 20101 17th Avenue Ct E
- 208th 231st St E
- 2022 201st St E
- 923 198th Street Ct E
- 1803 197th Street Ct E
- 20512 10th Ave E Unit 44
- 19631 19th Avenue Ct E
- 1921 208th St E Unit 81
- 20718 9th Avenue Ct E Unit 38
- 20615 7th Avenue Ct E
- 19519 19th Avenue Ct E
- 19851 23rd Avenue Ct E
- 1833 193rd Street Ct E
- 20523 5th Avenue Ct E
- 20412 5th Avenue Ct E
- 1405 202nd St E
- 20122 14th Avenue Ct E
- 20116 14th Avenue Ct E
- 1424 202nd Stct E
- 1419 202nd Stct E
- 1404 202nd Street Ct E
- 20128 14th Avenue Ct E
- 1408 202nd Street Ct E
- 20129 14th Avenue Ct E
- 1419 202nd St E
- 20123 14th Avenue Ct E
- 20205 13th Avenue Ct E
- 1412 202nd Street Ct E
- 20209 13th Avenue Ct E
- 20205 13th Avenue Ct E
- 20117 14th Avenue Ct E
- 20213 13th Avenue Ct E
- 20201 13th Avenue Ct E
- 20117 14th Av Ct E
- 20213 13th Avenue Ct E
Your Personal Tour Guide
Ask me questions while you tour the home.