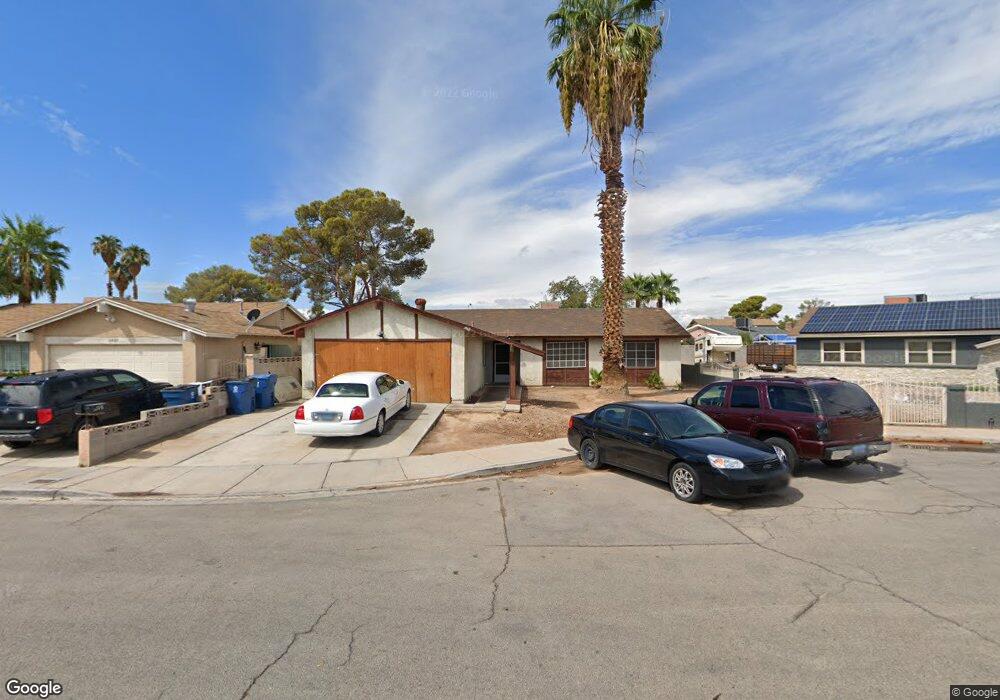
1405 Darling Ct Las Vegas, NV 89104
Estimated Value: $324,000 - $436,000
4
Beds
2
Baths
1,358
Sq Ft
$271/Sq Ft
Est. Value
About This Home
This home is located at 1405 Darling Ct, Las Vegas, NV 89104 and is currently estimated at $367,393, approximately $270 per square foot. 1405 Darling Ct is a home located in Clark County with nearby schools including Walter V. Long Elementary School, Jerome Mack Middle School, and Desert Pines High School.
Ownership History
Date
Name
Owned For
Owner Type
Purchase Details
Closed on
Oct 15, 2018
Sold by
Zamanian Mohammad
Bought by
Zamanian Roya Safari
Current Estimated Value
Purchase Details
Closed on
Aug 20, 2018
Sold by
Zamanian Mohammad Javad
Bought by
Zamanian Mohammad Javad
Purchase Details
Closed on
Dec 4, 1997
Sold by
Va
Bought by
Zamanian Mohammad J and Zamanian Roya S
Home Financials for this Owner
Home Financials are based on the most recent Mortgage that was taken out on this home.
Original Mortgage
$78,300
Outstanding Balance
$13,340
Interest Rate
7.31%
Mortgage Type
Seller Take Back
Estimated Equity
$354,053
Purchase Details
Closed on
Jun 8, 1997
Sold by
Ge Capital Mtg Services Inc
Bought by
Va
Purchase Details
Closed on
Apr 6, 1994
Sold by
Summers Sharon
Bought by
Hale Randy W
Home Financials for this Owner
Home Financials are based on the most recent Mortgage that was taken out on this home.
Original Mortgage
$91,800
Interest Rate
7.38%
Mortgage Type
VA
Create a Home Valuation Report for This Property
The Home Valuation Report is an in-depth analysis detailing your home's value as well as a comparison with similar homes in the area
Home Values in the Area
Average Home Value in this Area
Purchase History
| Date | Buyer | Sale Price | Title Company |
|---|---|---|---|
| Zamanian Roya Safari | -- | None Available | |
| Zamanian Mohammad Javad | -- | None Available | |
| Zamanian Mohammad J | -- | -- | |
| Va | -- | First American Title Co | |
| Ge Capital Mtg Services Inc | $80,841 | First American Title Co | |
| Hale Randy W | $90,000 | Fidelity National Title |
Source: Public Records
Mortgage History
| Date | Status | Borrower | Loan Amount |
|---|---|---|---|
| Open | Hale Randy W | $78,300 | |
| Previous Owner | Hale Randy W | $91,800 |
Source: Public Records
Tax History Compared to Growth
Tax History
| Year | Tax Paid | Tax Assessment Tax Assessment Total Assessment is a certain percentage of the fair market value that is determined by local assessors to be the total taxable value of land and additions on the property. | Land | Improvement |
|---|---|---|---|---|
| 2025 | $998 | $51,222 | $27,300 | $23,922 |
| 2024 | $925 | $51,222 | $27,300 | $23,922 |
| 2023 | $925 | $53,428 | $29,750 | $23,678 |
| 2022 | $857 | $46,584 | $24,500 | $22,084 |
| 2021 | $793 | $42,414 | $21,000 | $21,414 |
| 2020 | $734 | $42,315 | $20,650 | $21,665 |
| 2019 | $688 | $41,001 | $19,250 | $21,751 |
| 2018 | $656 | $36,930 | $15,750 | $21,180 |
| 2017 | $1,048 | $35,724 | $14,000 | $21,724 |
| 2016 | $616 | $32,685 | $10,150 | $22,535 |
| 2015 | $613 | $28,239 | $7,700 | $20,539 |
| 2014 | $594 | $22,246 | $5,600 | $16,646 |
Source: Public Records
Map
Nearby Homes
- 3887 Delling Ct
- 4057 Olive St
- 4067 E Colorado Ave
- 3724 Lanai Ave
- 1601 S Sandhill Rd Unit 78
- 1601 S Sandhill Rd Unit 191
- 49 Del Amo Dr
- 4055 E New York Ave
- 45 Prince Ln
- 1944 Randa Ln
- 89 Vallejo Ave
- 4217 Park Ct
- 4201 Essex Green Ct
- 4213 Essex Green Ct
- 1892 Miner Way
- 1147 May Ave
- 4280 Hampshire Green Ct
- 62 Smith Squire Ct
- 4237 Brockton Green Ct
- 63 Harrison Rose Ct
- 1421 Darling Ct
- 1389 Darling Ct
- 1406 Nedla Ct
- 1422 Nedla Ct Unit 25
- 1390 Nedla Ct
- 1373 Darling Ct
- 1406 Darling Ct
- 1422 Darling Ct Unit 25
- 1390 Darling Ct
- 3951 Olive St
- 3959 Olive St
- 3941 Olive St
- 3889 Arizona Ave
- 3901 Arizona Ave
- 3877 Arizona Ave Unit 24
- 1373 Nedla Ct
- 3969 Olive St
- 3931 Olive St
- 3911 Arizona Ave
- 3865 Arizona Ave