Estimated Value: $593,000 - $641,000
4
Beds
3
Baths
2,414
Sq Ft
$251/Sq Ft
Est. Value
About This Home
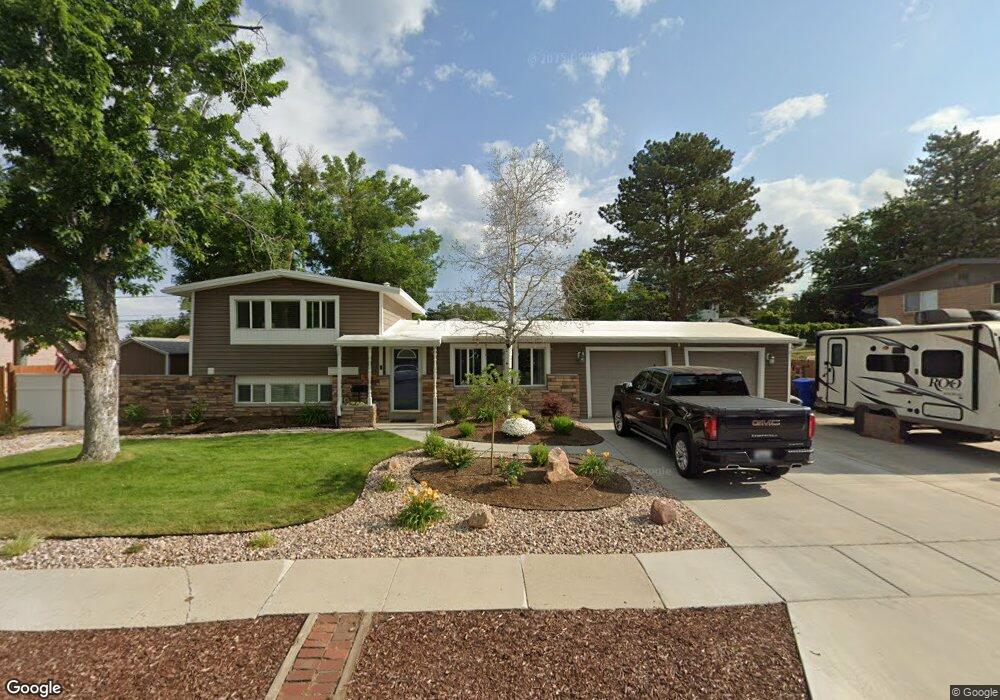
This home is located at 1405 E Galaxie Dr, Sandy, UT 84093 and is currently estimated at $606,627, approximately $251 per square foot. 1405 E Galaxie Dr is a home located in Salt Lake County with nearby schools including Peruvian Park Elementary School, Union Middle School, and Hillcrest High School.
Ownership History
Date
Name
Owned For
Owner Type
Purchase Details
Closed on
Sep 28, 2017
Sold by
Newman Kevin J and Newman Julie M
Bought by
Newman Kevin James and Maxine Julie
Current Estimated Value
Purchase Details
Closed on
Nov 30, 2007
Sold by
Newman Kevin and Newman Julie
Bought by
Newman Kevin J and Newman Julie M
Home Financials for this Owner
Home Financials are based on the most recent Mortgage that was taken out on this home.
Original Mortgage
$104,000
Outstanding Balance
$65,828
Interest Rate
6.3%
Mortgage Type
New Conventional
Estimated Equity
$540,799
Purchase Details
Closed on
Jan 31, 1997
Sold by
Beecher Mark and Beecher Kimberly
Bought by
Newman Kevin and Newman Julie
Home Financials for this Owner
Home Financials are based on the most recent Mortgage that was taken out on this home.
Original Mortgage
$113,906
Interest Rate
7.74%
Mortgage Type
VA
Purchase Details
Closed on
Feb 22, 1994
Sold by
Smith Richard A and Smith Nancy A
Bought by
Beecher Mark and Beecher Kimberly
Create a Home Valuation Report for This Property
The Home Valuation Report is an in-depth analysis detailing your home's value as well as a comparison with similar homes in the area
Home Values in the Area
Average Home Value in this Area
Purchase History
| Date | Buyer | Sale Price | Title Company |
|---|---|---|---|
| Newman Kevin James | -- | None Available | |
| Newman Kevin J | -- | Integrated Title Ins Svcs | |
| Newman Kevin | -- | -- | |
| Beecher Mark | -- | -- |
Source: Public Records
Mortgage History
| Date | Status | Borrower | Loan Amount |
|---|---|---|---|
| Open | Newman Kevin J | $104,000 | |
| Closed | Newman Kevin | $113,906 |
Source: Public Records
Tax History
| Year | Tax Paid | Tax Assessment Tax Assessment Total Assessment is a certain percentage of the fair market value that is determined by local assessors to be the total taxable value of land and additions on the property. | Land | Improvement |
|---|---|---|---|---|
| 2025 | $3,221 | $517,800 | $168,200 | $349,600 |
| 2024 | $3,221 | $489,500 | $157,200 | $332,300 |
| 2023 | $3,221 | $478,000 | $149,400 | $328,600 |
| 2022 | $3,298 | $488,500 | $146,500 | $342,000 |
| 2021 | $2,837 | $368,600 | $118,900 | $249,700 |
| 2020 | $2,670 | $324,700 | $118,900 | $205,800 |
| 2019 | $2,462 | $297,500 | $112,100 | $185,400 |
| 2018 | $2,363 | $289,300 | $112,100 | $177,200 |
| 2017 | $2,187 | $262,700 | $112,100 | $150,600 |
| 2016 | $2,314 | $268,000 | $112,100 | $155,900 |
| 2015 | $1,965 | $216,300 | $138,800 | $77,500 |
| 2014 | $1,855 | $198,900 | $130,000 | $68,900 |
Source: Public Records
Map
Nearby Homes
- 8797 S Capella Way
- 8857 S Capella Way
- 1430 E 8685 S
- 1371 Sudbury Ave
- 1579 E 8730 S
- 1482 Waters Ln
- 8935 Quarry Stone Way
- 8492 S Mesa Dr
- 8569 Round Stone Cove
- 8569 Round Stone Cove Unit 8
- 8411 S 1475 E
- 8638 Piper Ln
- 8492 Fayeway Dr
- 8642 S Cessna Cir
- 1138 E Quarry Stone Way
- 8971 Valley Bend Ct
- 8352 S 1330 E
- 8583 S Harvard Park Dr
- 1891 Richard Rd
- 1627 E Mulberry Way
- 1405 Galaxie Dr
- 1419 Galaxie Dr
- 1419 E Galaxie Dr
- 1393 Galaxie Dr
- 1404 E Capella Way
- 1404 Capella Way
- 1394 E Capella Way
- 1394 Capella Way
- 1420 Capella Way
- 1404 Galaxie Dr
- 1404 E Galaxie Dr
- 1379 Galaxie Dr
- 1379 E Galaxie Dr
- 1433 Galaxie Dr
- 1390 Galaxie Dr
- 1390 E Galaxie Dr
- 1420 E Galaxie Dr
- 1420 Galaxie Dr
- 1380 Capella Way
- 1432 E Capella Way
Your Personal Tour Guide
Ask me questions while you tour the home.