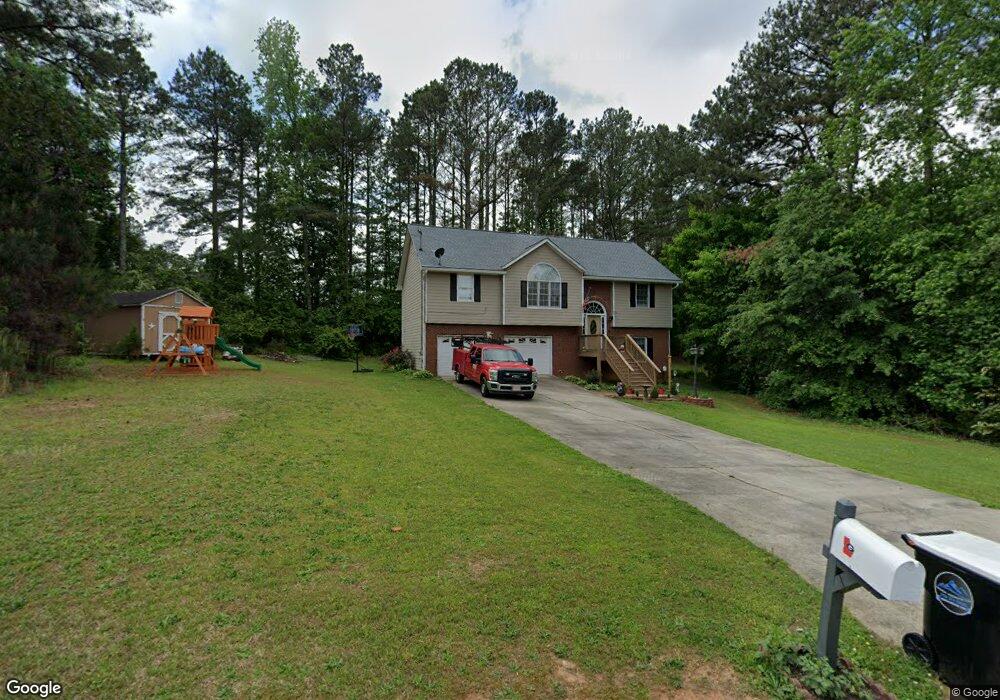
1405 Eagles Nest Cir Carrollton, GA 30116
Estimated Value: $271,000 - $296,796
4
Beds
3
Baths
1,949
Sq Ft
$146/Sq Ft
Est. Value
About This Home
This home is located at 1405 Eagles Nest Cir, Carrollton, GA 30116 and is currently estimated at $284,199, approximately $145 per square foot. 1405 Eagles Nest Cir is a home located in Carroll County with nearby schools including Central Elementary School, Central Middle School, and Central High School.
Ownership History
Date
Name
Owned For
Owner Type
Purchase Details
Closed on
Sep 18, 2020
Sold by
Elam Justin E
Bought by
Dillon Connor M
Current Estimated Value
Home Financials for this Owner
Home Financials are based on the most recent Mortgage that was taken out on this home.
Original Mortgage
$176,409
Outstanding Balance
$156,551
Interest Rate
2.9%
Mortgage Type
FHA
Estimated Equity
$127,648
Purchase Details
Closed on
May 25, 2016
Sold by
Elam Justin E
Bought by
Elam Justin E and Elam Natalie Suzanne
Home Financials for this Owner
Home Financials are based on the most recent Mortgage that was taken out on this home.
Original Mortgage
$129,310
Interest Rate
3.66%
Mortgage Type
FHA
Purchase Details
Closed on
Oct 22, 1999
Sold by
Mcdowell Dennis H
Bought by
Thompson Delmer E
Purchase Details
Closed on
Mar 20, 1998
Bought by
Mcdowell Dennis H
Create a Home Valuation Report for This Property
The Home Valuation Report is an in-depth analysis detailing your home's value as well as a comparison with similar homes in the area
Home Values in the Area
Average Home Value in this Area
Purchase History
| Date | Buyer | Sale Price | Title Company |
|---|---|---|---|
| Dillon Connor M | $182,500 | -- | |
| Elam Justin E | -- | -- | |
| Elam Justin E | $134,000 | -- | |
| Thompson Delmer E | $135,000 | -- | |
| Mcdowell Dennis H | -- | -- |
Source: Public Records
Mortgage History
| Date | Status | Borrower | Loan Amount |
|---|---|---|---|
| Open | Dillon Connor M | $176,409 | |
| Previous Owner | Elam Justin E | $129,310 |
Source: Public Records
Tax History Compared to Growth
Tax History
| Year | Tax Paid | Tax Assessment Tax Assessment Total Assessment is a certain percentage of the fair market value that is determined by local assessors to be the total taxable value of land and additions on the property. | Land | Improvement |
|---|---|---|---|---|
| 2024 | $2,554 | $112,886 | $7,400 | $105,486 |
| 2023 | $2,554 | $103,412 | $7,400 | $96,012 |
| 2022 | $2,083 | $83,054 | $6,000 | $77,054 |
| 2021 | $1,848 | $72,102 | $6,000 | $66,102 |
| 2020 | $1,475 | $57,452 | $6,000 | $51,452 |
| 2019 | $1,390 | $53,729 | $6,000 | $47,729 |
| 2018 | $1,155 | $43,968 | $4,000 | $39,968 |
| 2017 | $1,158 | $43,968 | $4,000 | $39,968 |
| 2016 | $1,159 | $43,968 | $4,000 | $39,968 |
| 2015 | $1,076 | $38,461 | $4,000 | $34,462 |
| 2014 | $935 | $33,292 | $4,000 | $29,292 |
Source: Public Records
Map
Nearby Homes
- 1425 Eagles Nest Cir
- 1440 Horsley Mill Rd
- 1430 Horsley Mill Rd
- 1385 Eagles Nest Cir
- 1408 Eagles Nest Cir Unit 101
- 1408 Eagles Nest Cir
- 1420 Horsley Mill Rd
- 1420 Eagles Nest Cir
- 1445 Eagles Nest Cir
- 1390 Eagles Nest Cir
- 1368 Eagles Nest Cir
- 1365 Eagles Nest Cir
- 1410 Horsley Mill Rd
- 1450 Eagles Nest Cir
- 1342 Eagles Nest Cir
- 1345 Eagles Nest Cir
- 100 Eagles Nest Cir
- 568 Eagles Nest Cir
- 586 Eagles Nest Cir
- 526 Eagles Nest Cir