Estimated Value: $367,000 - $540,000
4
Beds
2
Baths
2,176
Sq Ft
$203/Sq Ft
Est. Value
About This Home
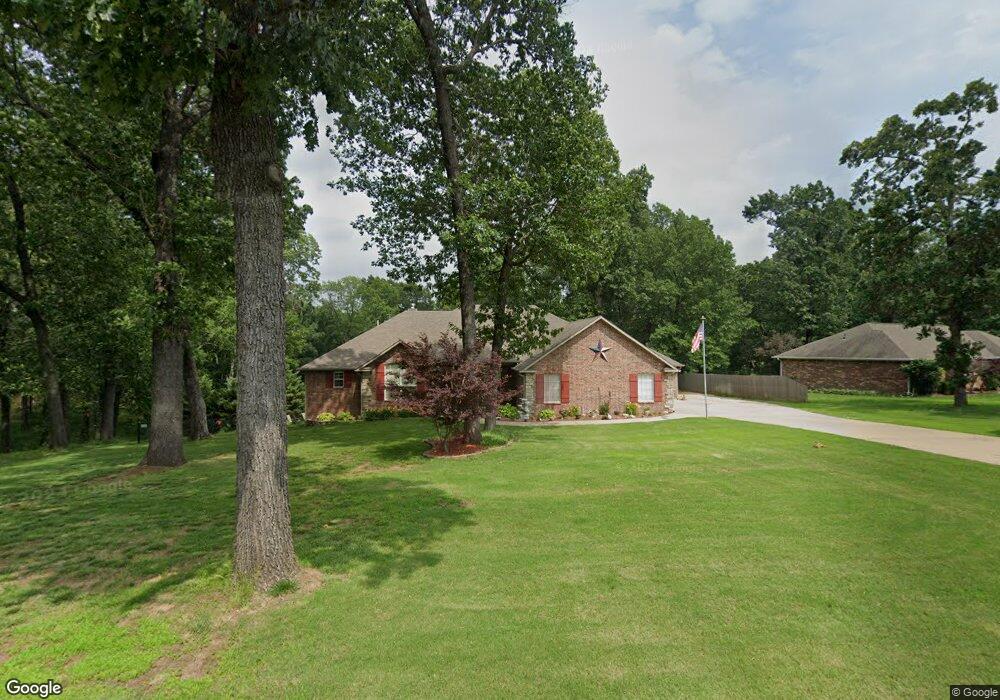
This home is located at 1405 Kayla St, Grove, OK 74344 and is currently estimated at $441,529, approximately $202 per square foot. 1405 Kayla St is a home located in Delaware County with nearby schools including Grove Lower Elementary School, Grove Upper Elementary School, and Grove Middle School.
Ownership History
Date
Name
Owned For
Owner Type
Purchase Details
Closed on
Jun 22, 2017
Sold by
Chastain Jim D and Chastain Terry L
Bought by
Sheppard Michael J and Sheppard Sally A
Current Estimated Value
Home Financials for this Owner
Home Financials are based on the most recent Mortgage that was taken out on this home.
Original Mortgage
$268,975
Outstanding Balance
$223,193
Interest Rate
4.02%
Mortgage Type
VA
Estimated Equity
$218,336
Purchase Details
Closed on
Sep 27, 2013
Sold by
Lagrone William and Lagrone Elinor
Bought by
Chastain Jim D and Chastain Terry L
Purchase Details
Closed on
Jun 15, 2009
Sold by
Herb Manning Incorporated
Bought by
Lagrone William and Lagrone Elinor
Home Financials for this Owner
Home Financials are based on the most recent Mortgage that was taken out on this home.
Original Mortgage
$159,200
Interest Rate
4.83%
Mortgage Type
Future Advance Clause Open End Mortgage
Create a Home Valuation Report for This Property
The Home Valuation Report is an in-depth analysis detailing your home's value as well as a comparison with similar homes in the area
Home Values in the Area
Average Home Value in this Area
Purchase History
| Date | Buyer | Sale Price | Title Company |
|---|---|---|---|
| Sheppard Michael J | $279,000 | Grand River Abstract & Title | |
| Chastain Jim D | $230,000 | Grand River Abstract & Title | |
| Lagrone William | $199,000 | -- |
Source: Public Records
Mortgage History
| Date | Status | Borrower | Loan Amount |
|---|---|---|---|
| Open | Sheppard Michael J | $268,975 | |
| Previous Owner | Lagrone William | $159,200 |
Source: Public Records
Tax History Compared to Growth
Tax History
| Year | Tax Paid | Tax Assessment Tax Assessment Total Assessment is a certain percentage of the fair market value that is determined by local assessors to be the total taxable value of land and additions on the property. | Land | Improvement |
|---|---|---|---|---|
| 2025 | $2,537 | $33,301 | $2,542 | $30,759 |
| 2024 | $2,537 | $32,331 | $2,468 | $29,863 |
| 2023 | $2,537 | $31,389 | $2,382 | $29,007 |
| 2022 | $2,461 | $30,476 | $2,358 | $28,118 |
| 2021 | $2,456 | $30,476 | $2,358 | $28,118 |
| 2020 | $2,497 | $30,476 | $2,358 | $28,118 |
| 2019 | $2,506 | $30,476 | $2,358 | $28,118 |
| 2018 | $2,501 | $30,476 | $2,358 | $28,118 |
| 2017 | $1,956 | $23,970 | $2,358 | $21,612 |
| 2016 | $1,963 | $24,068 | $2,243 | $21,825 |
| 2015 | $1,991 | $24,068 | $2,243 | $21,825 |
| 2014 | $2,001 | $24,068 | $2,243 | $21,825 |
Source: Public Records
Map
Nearby Homes
- 2666 Shasten St
- 1709 Cardiac Cove Rd
- 1000 Poplar
- 1305 Dubois
- 1407 W 9th St
- 1029 Village Dr
- 2243 Lower Waterfall Rd
- 622 Alpine Dr
- 1515 St Joseph Dr
- 1616 Battle Dr
- 0 Upper Waterfall Dr
- 0 Baycrest Ave
- 0 Tbd Melody Point Cir
- 511 Summit Dr
- 1621 Rockwood Dr
- 1628 Battle Dr
- 0 E 304 Rd Unit 25-955
- 0 E 304 Rd Unit 2518957
- 2300 Lookout Ln
- 1128 Rolling Oaks Rd
- 1501 Kayla St
- Lot 11 Kayla St
- 1401 Kayla St
- Lot 12 Kayla St
- Lot 10 Kayla St
- 1403 Kayla St
- 1300 Kayla St
- 0 Kayla St Unit 13-331
- 0 Kayla St Unit 10-741
- 0 Kayla St Unit 7-1280
- 0 Kayla St Unit 6-2210
- 0 Kayla St Unit 5-3037
- 0 Kayla St Unit 5-2081
- 0 Kayla St Unit 5-317
- 0 Kayla St Unit 15-452
- 0 Kayla St Unit 731360
- 1404 Kayla St
- 1500 Kayla St
- Lot 5 Buffalo Shores N
- 1503 Kayla St