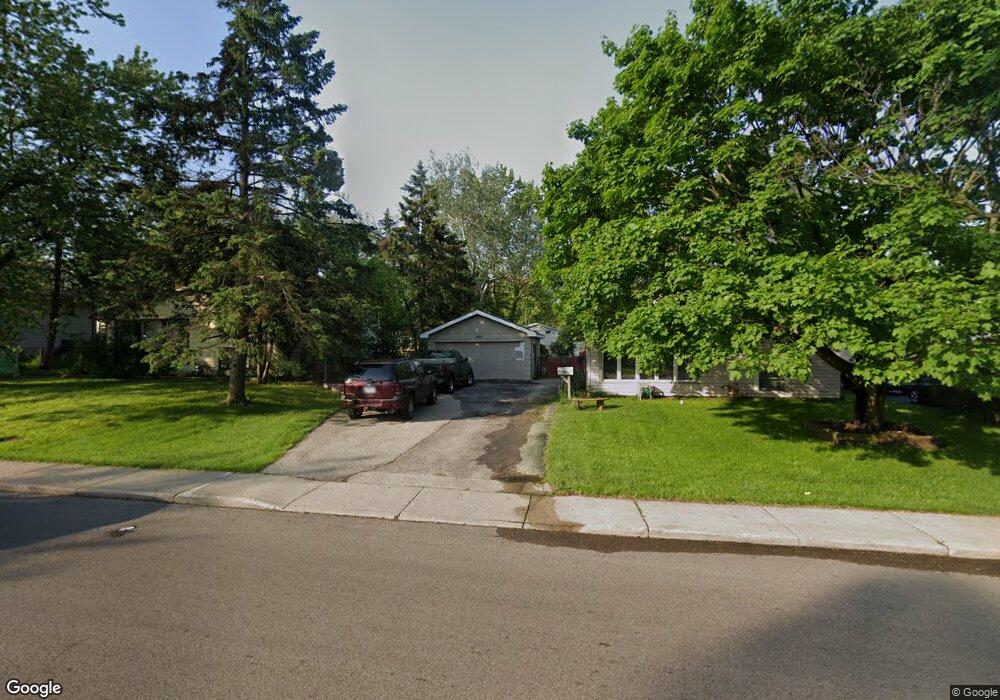
1405 Kings Rd Carpentersville, IL 60110
Estimated Value: $235,000 - $298,000
3
Beds
--
Bath
1,628
Sq Ft
$167/Sq Ft
Est. Value
About This Home
This home is located at 1405 Kings Rd, Carpentersville, IL 60110 and is currently estimated at $271,124, approximately $166 per square foot. 1405 Kings Rd is a home located in Kane County with nearby schools including Lakewood School, Crescent City Grade School, and Carpentersville Middle School.
Ownership History
Date
Name
Owned For
Owner Type
Purchase Details
Closed on
May 23, 2008
Sold by
Garcia Abel
Bought by
Garcia Abel and Garcia Maria
Current Estimated Value
Home Financials for this Owner
Home Financials are based on the most recent Mortgage that was taken out on this home.
Original Mortgage
$159,355
Outstanding Balance
$102,022
Interest Rate
6.09%
Mortgage Type
New Conventional
Estimated Equity
$169,102
Purchase Details
Closed on
Mar 17, 2004
Sold by
Soper Marvin W
Bought by
Garcia Abel
Home Financials for this Owner
Home Financials are based on the most recent Mortgage that was taken out on this home.
Original Mortgage
$130,500
Interest Rate
5.66%
Mortgage Type
Purchase Money Mortgage
Purchase Details
Closed on
Mar 2, 1995
Sold by
Va
Bought by
Soper Marvin W
Create a Home Valuation Report for This Property
The Home Valuation Report is an in-depth analysis detailing your home's value as well as a comparison with similar homes in the area
Home Values in the Area
Average Home Value in this Area
Purchase History
| Date | Buyer | Sale Price | Title Company |
|---|---|---|---|
| Garcia Abel | -- | Republic Title | |
| Garcia Abel | $145,000 | Multiple | |
| Soper Marvin W | -- | -- |
Source: Public Records
Mortgage History
| Date | Status | Borrower | Loan Amount |
|---|---|---|---|
| Open | Garcia Abel | $159,355 | |
| Closed | Garcia Abel | $130,500 |
Source: Public Records
Tax History Compared to Growth
Tax History
| Year | Tax Paid | Tax Assessment Tax Assessment Total Assessment is a certain percentage of the fair market value that is determined by local assessors to be the total taxable value of land and additions on the property. | Land | Improvement |
|---|---|---|---|---|
| 2024 | $4,957 | $73,449 | $12,553 | $60,896 |
| 2023 | $4,881 | $66,087 | $11,295 | $54,792 |
| 2022 | $4,528 | $58,000 | $11,295 | $46,705 |
| 2021 | $4,417 | $54,764 | $10,665 | $44,099 |
| 2020 | $4,342 | $53,533 | $10,425 | $43,108 |
| 2019 | $4,241 | $50,820 | $9,897 | $40,923 |
| 2018 | $4,057 | $46,882 | $9,701 | $37,181 |
| 2017 | $3,883 | $43,856 | $9,075 | $34,781 |
| 2016 | $3,566 | $38,414 | $8,787 | $29,627 |
| 2015 | -- | $31,963 | $8,234 | $23,729 |
| 2014 | -- | $28,609 | $8,007 | $20,602 |
| 2013 | -- | $29,485 | $8,252 | $21,233 |
Source: Public Records
Map
Nearby Homes
- 140 Hickory Dr
- 1426 Kings Rd
- 105 Siesta Rd
- 103 Hickory Dr
- 200 Amarillo Dr
- 57 Robin Rd
- 308 Amarillo Ct
- 944 Cortney Dr
- 171 Lake Shore Dr
- 7 Austin Ave
- 149 Austin Ave
- 4 Austin Ave
- 181 Skyline Dr
- 336 Delaware St
- 327 Tulsa Ave
- 2013 Silverstone Dr Unit 2013
- 7 Hickory Dr
- 94 Wren Rd
- 1431 Silverstone Dr Unit 1416
- 1811 IL Rte 25 (Elgin) Rd
- 1407 Kings Rd
- 1328 Sacramento Dr
- 1401 Kings Rd
- 1326 Sacramento Dr
- 1330 Sacramento Dr
- 1409 Kings Rd
- 1 Alameda Dr
- 1324 Sacramento Dr
- 1332 Sacramento Dr
- 2 Alameda Dr
- 1411 Kings Rd
- 3 Alameda Dr
- 1400 Kings Rd
- 1322 Sacramento Dr
- 4 Alameda Dr
- 1413 Kings Rd
- 461 Tulsa Ave
- 464 Tulsa Ave
- 5 Alameda Dr
- 1410 Kings Rd