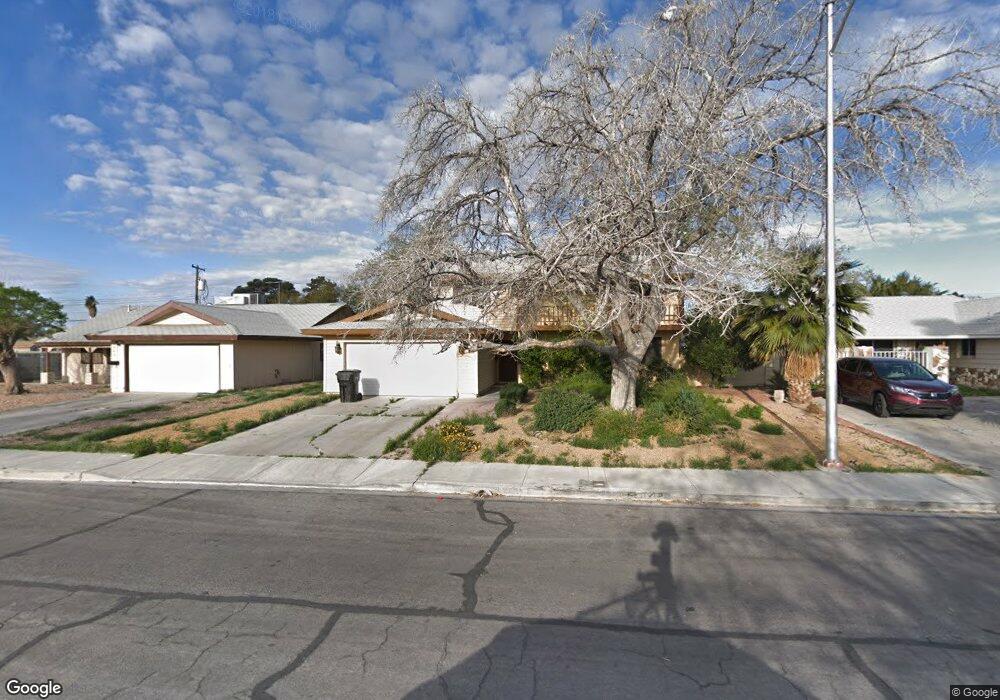
1405 Lucilee St Las Vegas, NV 89101
East Las Vegas NeighborhoodEstimated Value: $258,000 - $413,000
5
Beds
3
Baths
1,779
Sq Ft
$194/Sq Ft
Est. Value
About This Home
This home is located at 1405 Lucilee St, Las Vegas, NV 89101 and is currently estimated at $344,392, approximately $193 per square foot. 1405 Lucilee St is a home located in Clark County with nearby schools including Robert Lunt Elementary School, J.D. Smith Middle School, and Rancho High School.
Ownership History
Date
Name
Owned For
Owner Type
Purchase Details
Closed on
Oct 26, 2012
Sold by
Premiere Holdings Inc
Bought by
Premiere Holdings Residential Division L
Current Estimated Value
Purchase Details
Closed on
Apr 2, 2008
Sold by
Countrywide Home Loans Servicing Lp
Bought by
Liquidation Properties Inc
Purchase Details
Closed on
Feb 28, 2008
Sold by
Liquidation Properties Llc
Bought by
Premiere Holdings Inc
Purchase Details
Closed on
Oct 15, 2007
Sold by
Fobbs Robert A and Fobbs Latonya A
Bought by
Countrywide Home Loans Servicing Lp and Citigroup Global Markets Realty Corp
Purchase Details
Closed on
Aug 16, 2007
Sold by
Fobbs Robert A and Fobbs Latonya A
Bought by
Countrywide Home Loans Servicing Lp and Citigroup Global Markets Realty Corp
Create a Home Valuation Report for This Property
The Home Valuation Report is an in-depth analysis detailing your home's value as well as a comparison with similar homes in the area
Home Values in the Area
Average Home Value in this Area
Purchase History
| Date | Buyer | Sale Price | Title Company |
|---|---|---|---|
| Premiere Holdings Residential Division L | -- | None Available | |
| Liquidation Properties Inc | $105,000 | First American Title Howard | |
| Premiere Holdings Inc | $105,000 | First American Title Howard | |
| Countrywide Home Loans Servicing Lp | $215,280 | Fidelity National Title | |
| Countrywide Home Loans Servicing Lp | $215,280 | Fidelity National Title |
Source: Public Records
Tax History Compared to Growth
Tax History
| Year | Tax Paid | Tax Assessment Tax Assessment Total Assessment is a certain percentage of the fair market value that is determined by local assessors to be the total taxable value of land and additions on the property. | Land | Improvement |
|---|---|---|---|---|
| 2025 | $1,009 | $50,354 | $25,900 | $24,454 |
| 2024 | $934 | $50,354 | $25,900 | $24,454 |
| 2023 | $934 | $49,418 | $27,300 | $22,118 |
| 2022 | $866 | $43,239 | $23,450 | $19,789 |
| 2021 | $802 | $35,919 | $17,500 | $18,419 |
| 2020 | $741 | $33,647 | $15,750 | $17,897 |
| 2019 | $695 | $32,309 | $15,050 | $17,259 |
| 2018 | $663 | $29,075 | $12,950 | $16,125 |
| 2017 | $914 | $27,874 | $11,900 | $15,974 |
| 2016 | $622 | $24,585 | $8,050 | $16,535 |
| 2015 | $619 | $22,750 | $7,000 | $15,750 |
| 2014 | $600 | $18,320 | $4,200 | $14,120 |
Source: Public Records
Map
Nearby Homes
- 2901 Armin Ave
- 2746 E Owens Ave
- 2932 Demetrius Ave
- 1226 Coach Ln
- 2932 Theresa Ave
- 1305 Sattes St
- 1203 Mews Ln
- 3200 E Owens Ave
- 1424 Teton St
- 2900 Brady Ave
- 3220 Stanley Ave
- 3204 Osage Ave
- 2624 Brady Ave Unit 1
- 1628 Palmer St
- 0 E Reynolds Ave
- 2813 Willoughby Ave
- 1311 Flower Ave
- 1313 N 23rd St
- 3601 E Webb Ave
- 3320 Osage Ave
- 1409 Lucilee St
- 1403 Lucilee St
- 1400 Meyer St
- 1404 Meyer St
- 1413 Lucilee St
- 1332 Meyer St
- 1401 Lucilee St
- 1408 Meyer St
- 1404 Lucilee St
- 1400 Lucilee St
- 1408 Lucilee St
- 1328 Meyer St
- 1412 Meyer St
- 1417 Lucilee St
- 2828 Millie Ave
- 1324 Meyer St
- 2900 Millie Ave
- 2905 Millie Ave
- 2901 Mitzi Ave
- 2911 Mitzi Ave