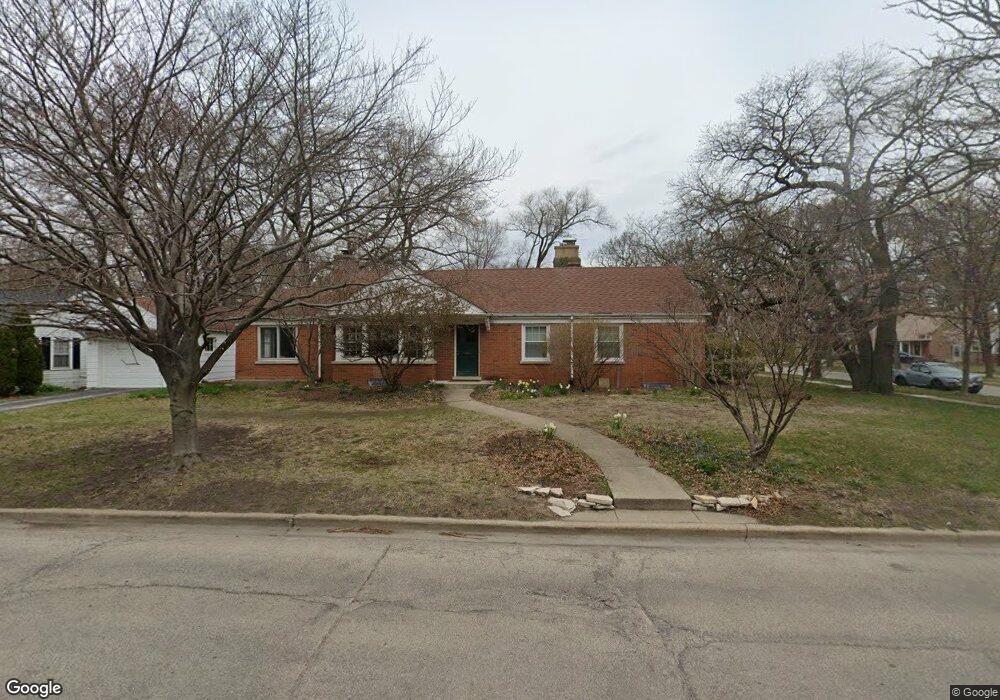
1405 Mulford St Evanston, IL 60202
Southwest Evanston NeighborhoodEstimated Value: $586,362 - $644,000
3
Beds
2
Baths
1,326
Sq Ft
$457/Sq Ft
Est. Value
About This Home
This home is located at 1405 Mulford St, Evanston, IL 60202 and is currently estimated at $605,591, approximately $456 per square foot. 1405 Mulford St is a home located in Cook County with nearby schools including Dawes Elementary School, Chute Middle School, and Evanston Township High School.
Ownership History
Date
Name
Owned For
Owner Type
Purchase Details
Closed on
Jun 21, 2021
Sold by
Rhodes Jean K
Bought by
Holt Alexander B
Current Estimated Value
Home Financials for this Owner
Home Financials are based on the most recent Mortgage that was taken out on this home.
Original Mortgage
$400,000
Outstanding Balance
$360,309
Interest Rate
2.99%
Mortgage Type
New Conventional
Estimated Equity
$245,282
Purchase Details
Closed on
Oct 22, 2001
Sold by
Kniaz Daniel E and Roberts Pamela J
Bought by
Rhodes Jean K
Home Financials for this Owner
Home Financials are based on the most recent Mortgage that was taken out on this home.
Original Mortgage
$265,500
Interest Rate
6.88%
Mortgage Type
Balloon
Purchase Details
Closed on
Jun 14, 1995
Sold by
Eollinger Rosemary
Bought by
Kniaz Daniel E and Roberts Pamella J
Home Financials for this Owner
Home Financials are based on the most recent Mortgage that was taken out on this home.
Original Mortgage
$195,300
Interest Rate
6.31%
Create a Home Valuation Report for This Property
The Home Valuation Report is an in-depth analysis detailing your home's value as well as a comparison with similar homes in the area
Home Values in the Area
Average Home Value in this Area
Purchase History
| Date | Buyer | Sale Price | Title Company |
|---|---|---|---|
| Holt Alexander B | $500,000 | Chicago Title | |
| Rhodes Jean K | $364,500 | Centennial Title Incorporate | |
| Kniaz Daniel E | $217,000 | -- |
Source: Public Records
Mortgage History
| Date | Status | Borrower | Loan Amount |
|---|---|---|---|
| Open | Holt Alexander B | $400,000 | |
| Previous Owner | Rhodes Jean K | $265,500 | |
| Previous Owner | Kniaz Daniel E | $195,300 |
Source: Public Records
Tax History
| Year | Tax Paid | Tax Assessment Tax Assessment Total Assessment is a certain percentage of the fair market value that is determined by local assessors to be the total taxable value of land and additions on the property. | Land | Improvement |
|---|---|---|---|---|
| 2025 | $11,283 | $47,000 | $12,977 | $34,023 |
| 2024 | $11,283 | $46,000 | $10,981 | $35,019 |
| 2023 | $10,824 | $46,000 | $10,981 | $35,019 |
| 2022 | $10,824 | $46,000 | $10,981 | $35,019 |
| 2021 | $8,113 | $36,158 | $7,986 | $28,172 |
| 2020 | $8,111 | $36,158 | $7,986 | $28,172 |
| 2019 | $8,124 | $40,400 | $7,986 | $32,414 |
| 2018 | $7,462 | $33,062 | $6,655 | $26,407 |
| 2017 | $8,025 | $33,062 | $6,655 | $26,407 |
| 2016 | $7,834 | $33,062 | $6,655 | $26,407 |
| 2015 | $6,216 | $25,479 | $5,490 | $19,989 |
| 2014 | $6,171 | $25,479 | $5,490 | $19,989 |
| 2013 | $6,012 | $25,479 | $5,490 | $19,989 |
Source: Public Records
Map
Nearby Homes
- 1321 Brummel St
- 1412 Brummel St Unit 2E
- 1217 Hull Terrace Unit 3A
- 1517 Dobson St
- 2507 W Howard St
- 1104 Austin St
- 1609 Howard St Unit 2
- 1800 Kirk St
- 538 Wesley Ave
- 439 Ridge Ave Unit 2
- 135 Ridge Ave Unit 1W
- 1736 Keeney St
- 817 Brummel St Unit 2N
- 7446 N Rockwell St
- 7540 N Ridge Blvd Unit 6C
- 828 Oakton St Unit 3F
- 820 Dobson St Unit 3E
- 803 Brummel St
- 1507 Cleveland St
- 517 Elmwood Ave
- 306 Wesley Ave
- 310 Wesley Ave
- 312 Wesley Ave
- 805-807 Mulford St
- 316 Wesley Ave
- 1325 Mulford St
- 301 Ashland Ave
- 307 Wesley Ave
- 305 Ashland Ave
- 309 Ashland Ave
- 311 Wesley Ave
- 320 Wesley Ave
- 315 Ashland Ave
- 313 Wesley Ave
- 1320 Mulford St
- 321 Ashland Ave
- 1422 Mulford St
- 319 Wesley Ave
- 319 Westley Ave
- 324 Wesley Ave
Your Personal Tour Guide
Ask me questions while you tour the home.