Estimated Value: $178,000 - $180,637
3
Beds
2
Baths
1,500
Sq Ft
$120/Sq Ft
Est. Value
About This Home
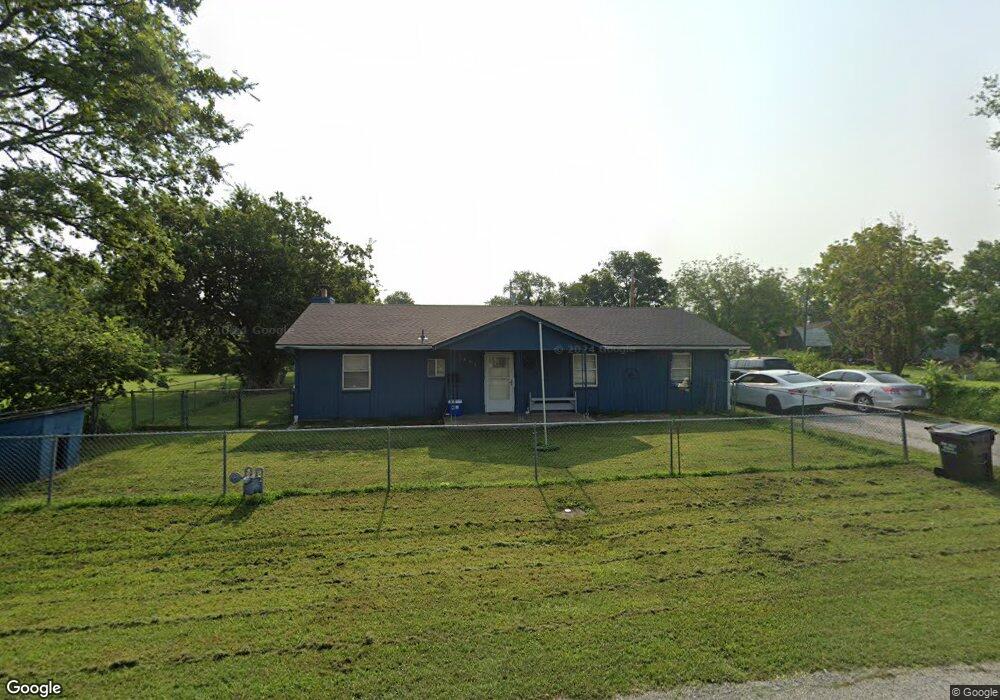
This home is located at 1405 N 155th East Ave, Tulsa, OK 74116 and is currently estimated at $179,409, approximately $119 per square foot. 1405 N 155th East Ave is a home located in Rogers County with nearby schools including Wells Middle School, Catoosa High School, and Lincoln Christian School.
Ownership History
Date
Name
Owned For
Owner Type
Purchase Details
Closed on
Jul 20, 2020
Sold by
Robison Corvan Robbie and Robison Katelyn
Bought by
Ornder Kenneth Lee
Current Estimated Value
Home Financials for this Owner
Home Financials are based on the most recent Mortgage that was taken out on this home.
Original Mortgage
$116,150
Outstanding Balance
$102,764
Interest Rate
3.1%
Mortgage Type
New Conventional
Estimated Equity
$76,645
Purchase Details
Closed on
Jul 17, 2009
Sold by
Coffelt Cavin and Coffelt Karen
Bought by
Robinson Corvan Robbie
Home Financials for this Owner
Home Financials are based on the most recent Mortgage that was taken out on this home.
Original Mortgage
$78,059
Interest Rate
5.41%
Mortgage Type
FHA
Purchase Details
Closed on
May 7, 2001
Sold by
Mccoy Joe
Purchase Details
Closed on
Mar 8, 2001
Sold by
Manufacturers & Traders~Trust Co-In
Purchase Details
Closed on
Sep 27, 2000
Sold by
Kyles Thomas David
Create a Home Valuation Report for This Property
The Home Valuation Report is an in-depth analysis detailing your home's value as well as a comparison with similar homes in the area
Home Values in the Area
Average Home Value in this Area
Purchase History
| Date | Buyer | Sale Price | Title Company |
|---|---|---|---|
| Ornder Kenneth Lee | $115,000 | Integrity Title And Closing | |
| Robinson Corvan Robbie | $79,500 | None Available | |
| -- | $75,000 | -- | |
| -- | $41,500 | -- | |
| -- | -- | -- |
Source: Public Records
Mortgage History
| Date | Status | Borrower | Loan Amount |
|---|---|---|---|
| Open | Ornder Kenneth Lee | $116,150 | |
| Previous Owner | Robinson Corvan Robbie | $78,059 |
Source: Public Records
Tax History Compared to Growth
Tax History
| Year | Tax Paid | Tax Assessment Tax Assessment Total Assessment is a certain percentage of the fair market value that is determined by local assessors to be the total taxable value of land and additions on the property. | Land | Improvement |
|---|---|---|---|---|
| 2025 | $1,306 | $12,995 | $1,493 | $11,502 |
| 2024 | $1,306 | $12,377 | $1,422 | $10,955 |
| 2023 | $1,306 | $11,788 | $1,100 | $10,688 |
| 2022 | $1,151 | $11,468 | $1,100 | $10,368 |
| 2021 | $1,049 | $11,925 | $1,100 | $10,825 |
| 2020 | $837 | $10,709 | $550 | $10,159 |
| 2019 | $821 | $10,142 | $550 | $9,592 |
| 2018 | $855 | $10,579 | $550 | $10,029 |
| 2017 | $839 | $10,294 | $550 | $9,744 |
| 2016 | $800 | $9,994 | $550 | $9,444 |
| 2015 | $781 | $9,703 | $550 | $9,153 |
| 2014 | $762 | $9,421 | $550 | $8,871 |
Source: Public Records
Map
Nearby Homes
- 1323 N 151st East Ave
- 16103 E Oklahoma St
- 16319 E Oklahoma Place
- 14805 E Latimer St
- 16711 E Oklahoma St
- 16429 E 1st St
- 18 S 166th East Ave
- 16215 E 1st St
- 106 S 166th East Ave
- 105 S 166th East Ave
- 16642 E Admiral Blvd
- 1150 N Lynn Lane Rd
- 154 S 166th East Ave
- 17220 E Admiral Place
- 139 S 169th East Ave
- 411 S 162nd East Ave
- 16420 E 3rd St
- 427 S 162nd East Ave
- 1274 Sleepy Hollow
- 17711 E Archer St
- 1410 N 156th East Ave
- 1403 N 155th East Ave
- 1461 N 156th East Ave
- 1408 N 155th East Ave
- 1406 N 155th East Ave
- 1410 N 155th East Ave
- 1402 N 156th East Ave
- 1402 N 155th East Ave
- 1462 N 155th East Ave
- 15620 E Pine St
- 1403 N 156th East Ave
- 1402 N 157th East Ave
- 1345 N 155th East Ave
- 1345 N 155th East Ave
- 15548 E Oklahoma St
- 15401 E Oklahoma St
- 15458 E Oklahoma St
- 15406 E Pine St
- 1437 N 154th East Ave
- 1342 N 155th East Ave