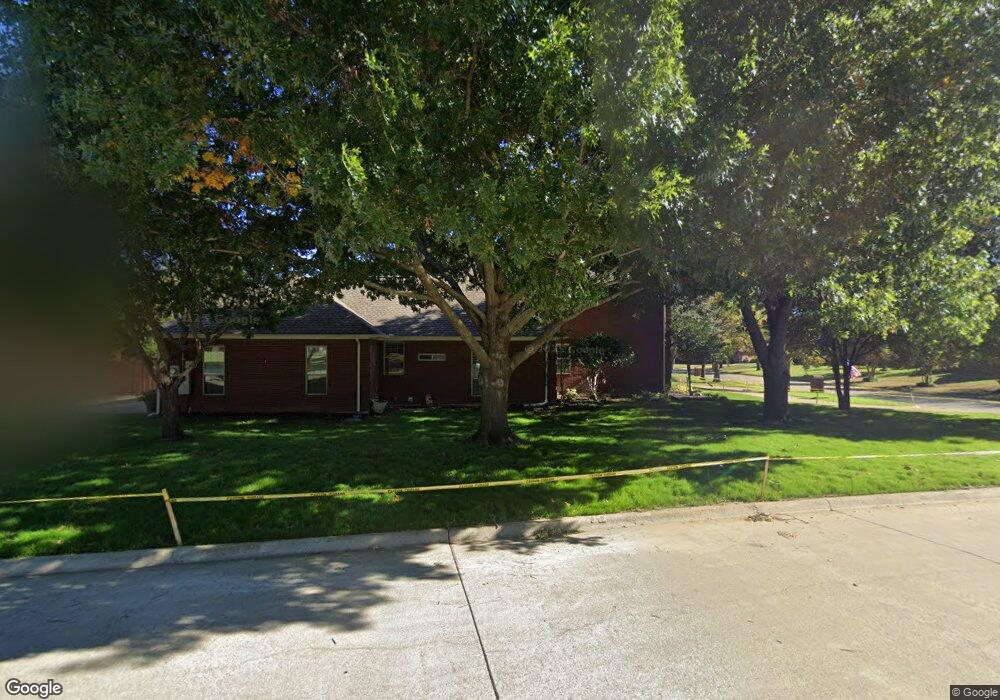
1405 Northridge Dr Southlake, TX 76092
Estimated Value: $1,125,000 - $1,230,000
4
Beds
3
Baths
3,225
Sq Ft
$359/Sq Ft
Est. Value
About This Home
This home is located at 1405 Northridge Dr, Southlake, TX 76092 and is currently estimated at $1,158,518, approximately $359 per square foot. 1405 Northridge Dr is a home located in Tarrant County with nearby schools including Carroll Elementary School, Eubanks Intermediate School, and George Dawson Middle School.
Ownership History
Date
Name
Owned For
Owner Type
Purchase Details
Closed on
Aug 31, 2009
Sold by
King Robert Darrell and Bailey King Kimberly Ann
Bought by
Meenan Marlene J and Meenan Kevin G
Current Estimated Value
Home Financials for this Owner
Home Financials are based on the most recent Mortgage that was taken out on this home.
Original Mortgage
$310,000
Outstanding Balance
$201,192
Interest Rate
5.2%
Mortgage Type
New Conventional
Estimated Equity
$957,326
Purchase Details
Closed on
Jul 18, 2002
Sold by
Lynn John C and Lynn Betty J
Bought by
King Robert Darrell and Bailey King Kimberly Ann
Home Financials for this Owner
Home Financials are based on the most recent Mortgage that was taken out on this home.
Original Mortgage
$270,750
Interest Rate
6.73%
Create a Home Valuation Report for This Property
The Home Valuation Report is an in-depth analysis detailing your home's value as well as a comparison with similar homes in the area
Home Values in the Area
Average Home Value in this Area
Purchase History
| Date | Buyer | Sale Price | Title Company |
|---|---|---|---|
| Meenan Marlene J | -- | First American Title Ins Co | |
| King Robert Darrell | -- | Allegiance Title Company |
Source: Public Records
Mortgage History
| Date | Status | Borrower | Loan Amount |
|---|---|---|---|
| Open | Meenan Marlene J | $310,000 | |
| Previous Owner | King Robert Darrell | $270,750 |
Source: Public Records
Tax History Compared to Growth
Tax History
| Year | Tax Paid | Tax Assessment Tax Assessment Total Assessment is a certain percentage of the fair market value that is determined by local assessors to be the total taxable value of land and additions on the property. | Land | Improvement |
|---|---|---|---|---|
| 2025 | $13,594 | $982,931 | $390,900 | $592,031 |
| 2024 | $13,594 | $987,872 | $390,900 | $596,972 |
| 2023 | $14,954 | $1,007,065 | $390,900 | $616,165 |
| 2022 | $16,091 | $881,629 | $263,250 | $618,379 |
| 2021 | $15,459 | $678,039 | $263,250 | $414,789 |
| 2020 | $14,912 | $648,731 | $248,850 | $399,881 |
| 2019 | $15,168 | $626,387 | $150,000 | $476,387 |
| 2018 | $13,244 | $582,712 | $110,000 | $472,712 |
| 2017 | $13,130 | $529,738 | $110,000 | $419,738 |
| 2016 | $12,159 | $490,571 | $110,000 | $380,571 |
| 2015 | $10,798 | $448,000 | $50,000 | $398,000 |
| 2014 | $10,798 | $448,000 | $50,000 | $398,000 |
Source: Public Records
Map
Nearby Homes
- 1002 Chimney Hill Trail
- 1206 Oakwood Trail
- 690 S Peytonville Ave
- 1205 Scenic Dr
- 1196 W Continental Blvd
- 1212 Oakwood Trail
- 710 Deer Hollow Blvd
- 945 Deer Hollow Blvd
- 1010 Deer Hollow Blvd
- 608 Stratford Dr
- 1904 Cresson Dr
- 900 Kingsbury Way
- 929 Winding Ridge Trail
- 503 Indian Paintbrush Way
- 7702 Tillman Hill Rd
- 305 Sheffield Dr
- 203 Manor Place
- 7511 Mount Vernon Dr
- 806 Shadow Glen Dr
- 800 Woodcrest Ct
- 1403 Northridge Dr
- 907 Meadow Ln
- 1407 Northridge Dr
- 912 Chimney Hill Trail
- 1001 Meadow Ct
- 908 Chimney Hill Trail
- 905 Meadow Ln
- 1401 Northridge Dr
- 906 Meadow Ln
- 1000 Meadow Ct
- 906 Chimney Hill Trail
- 1402 Northridge Dr
- 1003 Meadow Ct
- 903 Meadow Ln
- 1409 Northridge Dr
- 1400 Northridge Dr
- 904 Meadow Ln
- 1002 Meadow Ct
- 904 Chimney Hill Trail
- 913 Chimney Hill Trail