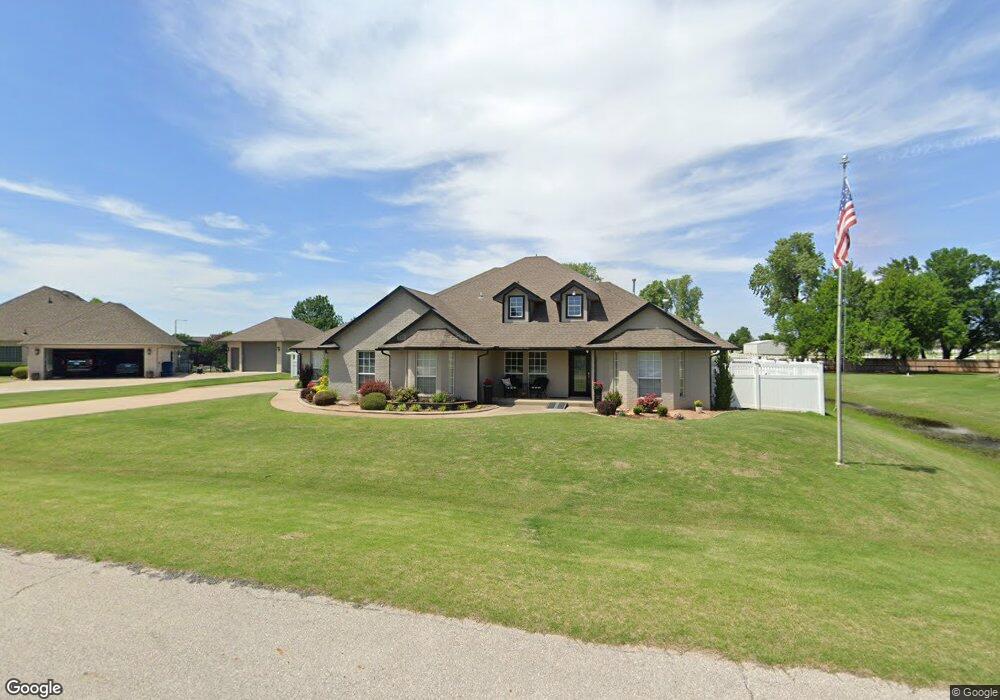
1405 Quail Lake Way Mustang, OK 73064
Estimated Value: $428,000 - $515,000
4
Beds
2
Baths
2,606
Sq Ft
$176/Sq Ft
Est. Value
About This Home
This home is located at 1405 Quail Lake Way, Mustang, OK 73064 and is currently estimated at $459,708, approximately $176 per square foot. 1405 Quail Lake Way is a home located in Canadian County with nearby schools including Mustang Lakehoma Elementary School, Mustang Horizon Intermediate School, and Mustang Middle School.
Ownership History
Date
Name
Owned For
Owner Type
Purchase Details
Closed on
Aug 7, 2015
Sold by
Mcdowell Janet Joan
Bought by
Lafever Lynn W and Lafever Linda R
Current Estimated Value
Home Financials for this Owner
Home Financials are based on the most recent Mortgage that was taken out on this home.
Original Mortgage
$211,200
Interest Rate
4.06%
Mortgage Type
Unknown
Purchase Details
Closed on
Aug 3, 2006
Sold by
Burke Michael D and Burke Jo Ellen
Bought by
Burke Family Trust
Purchase Details
Closed on
Jun 3, 2002
Sold by
Sheffield Michael C
Purchase Details
Closed on
Aug 29, 2001
Sold by
Four Winds Development Llc
Purchase Details
Closed on
Sep 15, 2000
Sold by
Edgewood Development Llc
Create a Home Valuation Report for This Property
The Home Valuation Report is an in-depth analysis detailing your home's value as well as a comparison with similar homes in the area
Home Values in the Area
Average Home Value in this Area
Purchase History
| Date | Buyer | Sale Price | Title Company |
|---|---|---|---|
| Lafever Lynn W | $240,000 | First American Title | |
| Burke Family Trust | -- | Stamp Tax O S Title 68 | |
| -- | $26,500 | -- | |
| -- | $21,000 | -- | |
| -- | $128,000 | -- |
Source: Public Records
Mortgage History
| Date | Status | Borrower | Loan Amount |
|---|---|---|---|
| Closed | Lafever Lynn W | $211,200 |
Source: Public Records
Tax History Compared to Growth
Tax History
| Year | Tax Paid | Tax Assessment Tax Assessment Total Assessment is a certain percentage of the fair market value that is determined by local assessors to be the total taxable value of land and additions on the property. | Land | Improvement |
|---|---|---|---|---|
| 2024 | $3,528 | $37,457 | $3,000 | $34,457 |
| 2023 | $3,528 | $36,366 | $3,000 | $33,366 |
| 2022 | $3,464 | $35,307 | $3,000 | $32,307 |
| 2021 | $3,374 | $34,279 | $3,000 | $31,279 |
| 2020 | $3,370 | $34,041 | $3,000 | $31,041 |
| 2019 | $3,269 | $33,049 | $3,000 | $30,049 |
| 2018 | $3,240 | $32,087 | $3,000 | $29,087 |
| 2017 | $3,107 | $31,152 | $3,000 | $28,152 |
| 2016 | $3,020 | $30,245 | $3,000 | $27,245 |
| 2015 | $3,236 | $29,730 | $3,000 | $26,730 |
| 2014 | $3,236 | $31,163 | $2,400 | $28,763 |
Source: Public Records
Map
Nearby Homes
- 1400 Quail Lake Way
- 1012 N Scouts Court Way
- 5108 Mccann Ct
- 1305 N Hunters Bridge Way
- 1401 W Harvard Way
- 1425 W Harvard Way
- 1208 W Flowering Peach Way
- 0 SW 59th St
- 1316 W Harvard Way
- 913 N Centennial Way
- 1308 W Harvard Way
- 1250 N Tea Olive Way
- 1408 N Golden Bell Way
- 1721 W Antler Way
- 5409 Heidelberg Dr
- 1005 W Ridgehaven Way
- 821 N Clear Springs Way
- 609 N Centennial Way
- 900 W Nandina Way
- 513 N Shannon Way
- 1409 Quail Lake Way
- 1401 Quail Lake Way
- 1404 Quail Lake Way
- 1408 Quail Lake Way
- 1311 Quail Lake Way
- 1412 Quail Lake Way
- 1308 Quail Lake Way
- 1501 Quail Lake Way
- 1309 Quail Lake Way
- 1500 Quail Lake Way
- 1500 Quail Lake Way
- 1304 Quail Lake Way
- 1505 Quail Lake Way
- 1305 Quail Lake Way
- 1504 Quail Lake Way
- 1300 Quail Lake Way
- 1509 Quail Lake Way
- 1009 N Pheasant Way
- 1017 N Pheasant Way
- 5116 Mccann Ct