Estimated payment $1,029/month
Highlights
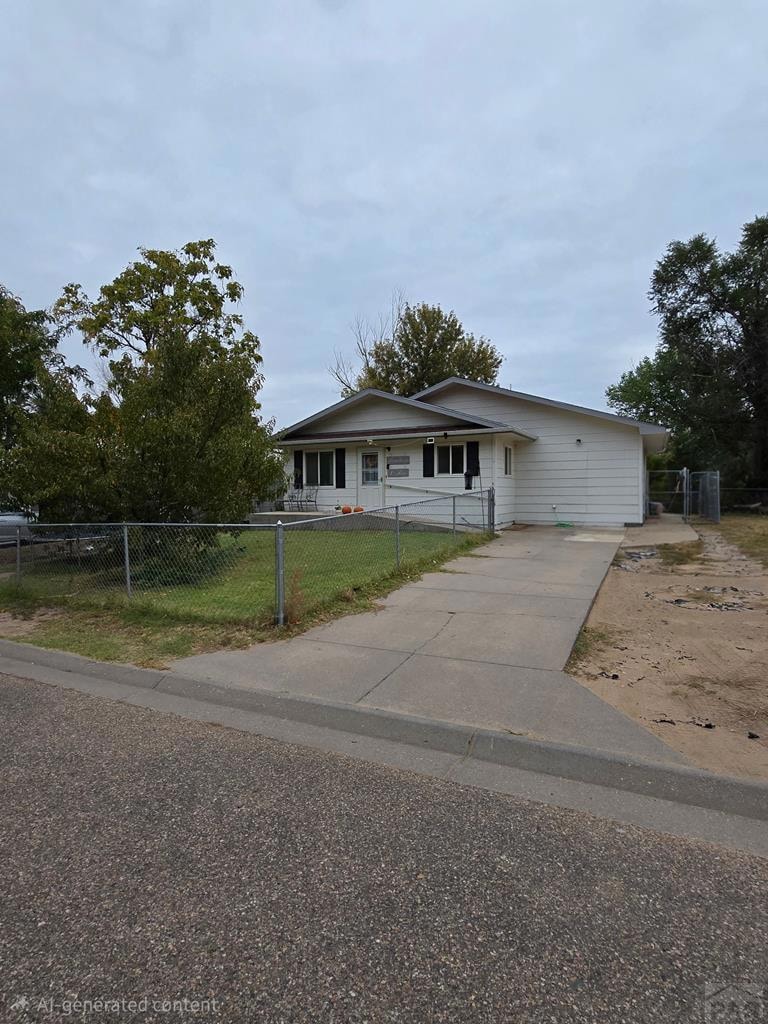
- Ranch Style House
- No HOA
- Front Porch
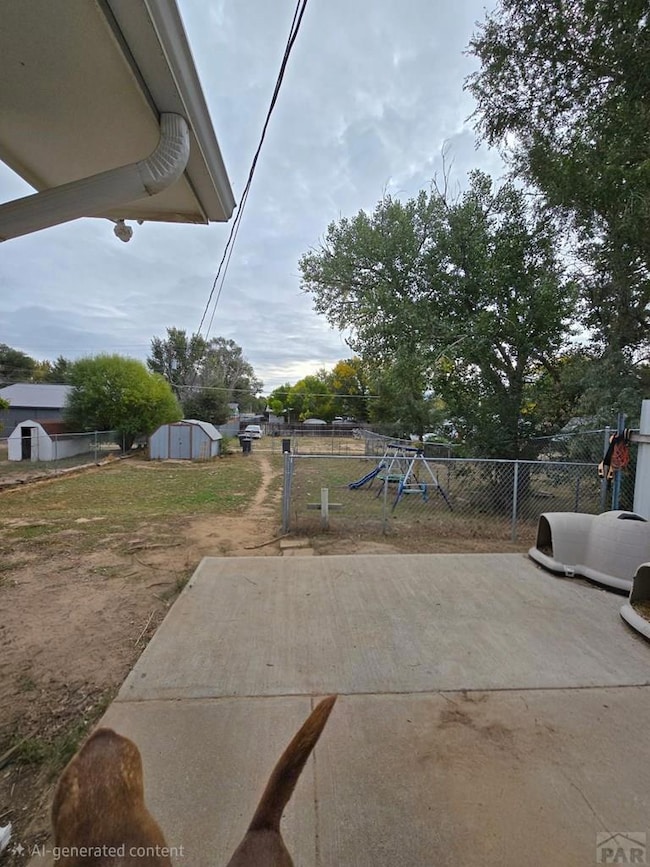
- Lawn
- Double Oven
- Refrigerated Cooling System
About This Home
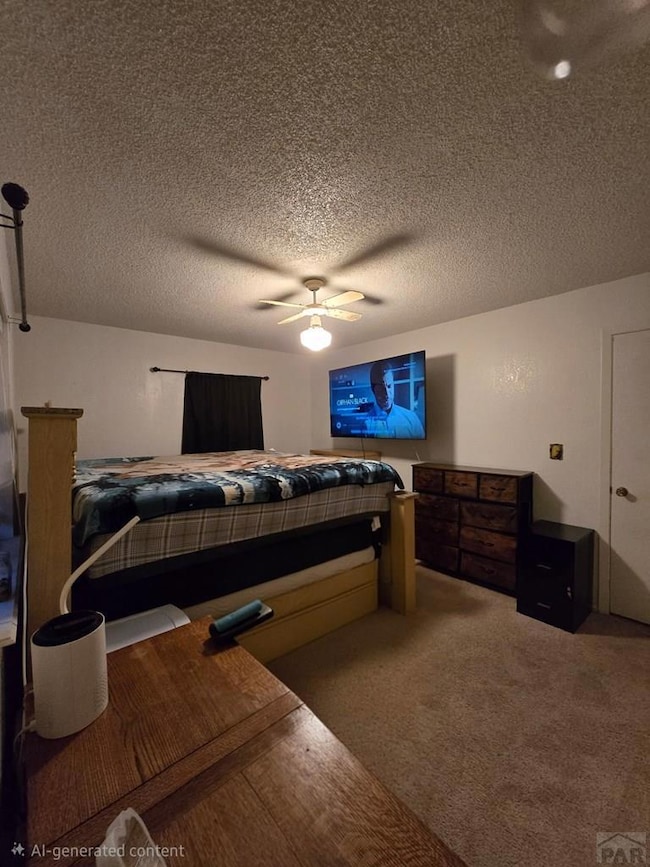
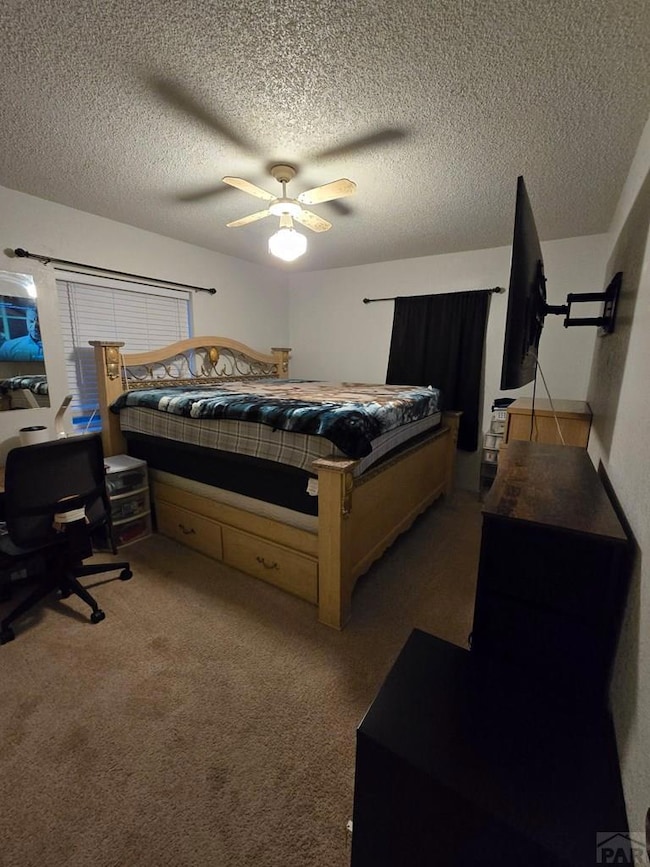
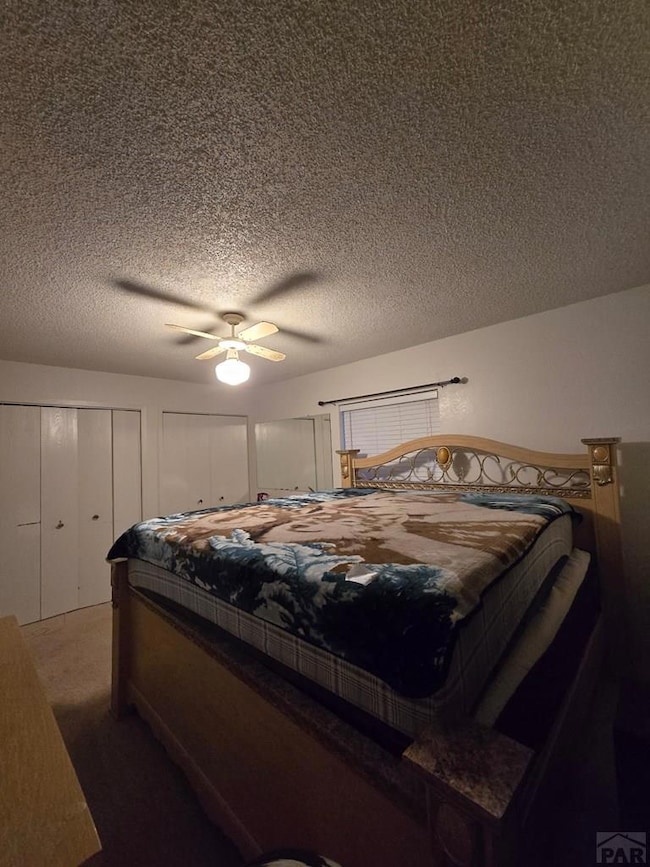
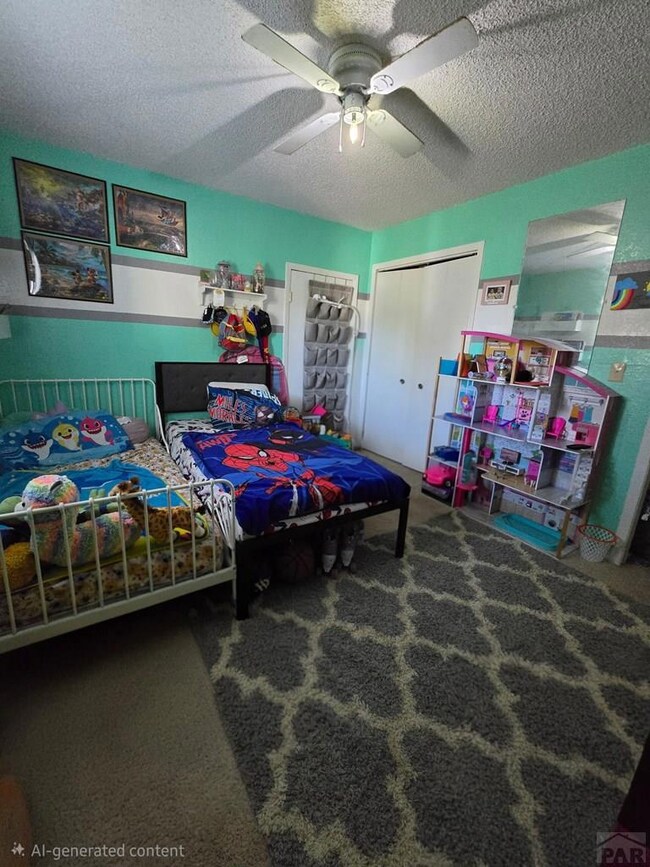
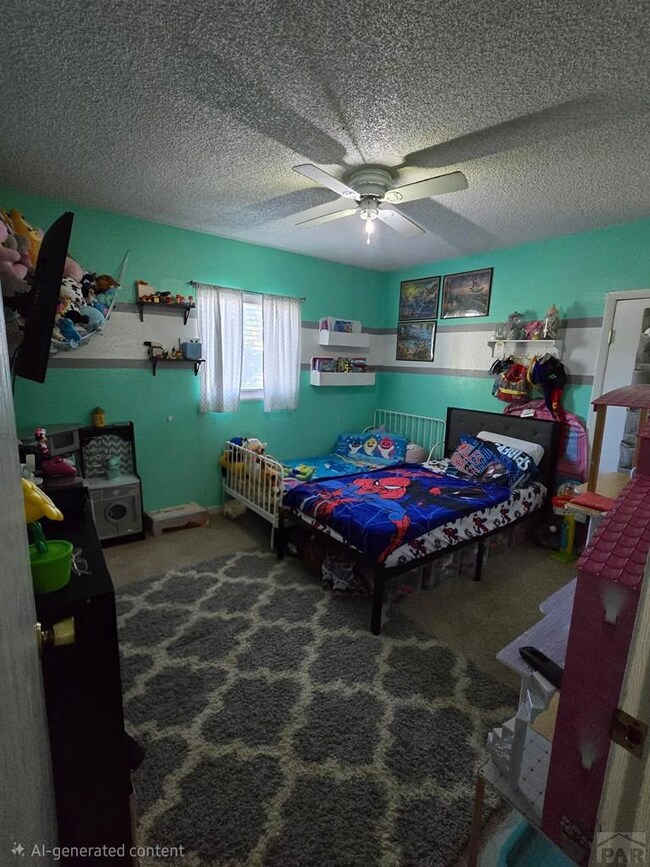
This well-maintained 1,200 square foot residence offers a range of desirable features, including three bedrooms, two bathrooms, vinyl windows, and central heating and air conditioning. The property is secured with fenced front and back yards, complemented by a camera system and large monitor for enhanced security. Both the interior and exterior of this home are visually appealing, making it an outstanding option at a competitive price.
Listing Agent
Wilson Realty Brokerage Phone: 7196882925 License #100015920 Listed on: 10/19/2025
Home Details
Home Type
- Single Family
Est. Annual Taxes
- $319
Year Built
- Built in 1983
Lot Details
- 8,102 Sq Ft Lot
- Lot Dimensions are 54 x 150
- Kennel
- Aluminum or Metal Fence
- Landscaped with Trees
- Lawn
Parking
- No Garage
Home Design
- Ranch Style House
- Frame Construction
- Composition Roof
- Wood Siding
- Lead Paint Disclosure
Interior Spaces
- 1,200 Sq Ft Home
- Vinyl Clad Windows
- Living Room
- Security System Owned
- Double Oven
- Laundry on main level
Bedrooms and Bathrooms
- 3 Bedrooms
- 2 Bathrooms
Outdoor Features
- Shed
- Front Porch
Utilities
- Refrigerated Cooling System
- Forced Air Heating System
- Heating System Uses Natural Gas
- Gas Water Heater
Community Details
- No Home Owners Association
- Lamar Subdivision
Listing and Financial Details
- Exclusions: Seller's Personal Property, Washer, Dryer, Freezer.
Map
Home Values in the Area
Average Home Value in this Area
Tax History
| Year | Tax Paid | Tax Assessment Tax Assessment Total Assessment is a certain percentage of the fair market value that is determined by local assessors to be the total taxable value of land and additions on the property. | Land | Improvement |
|---|---|---|---|---|
| 2024 | $319 | $0 | $0 | $0 |
| 2023 | $319 | $41,073 | $2,875 | $38,198 |
| 2022 | $421 | $41,073 | $2,875 | $38,198 |
| 2021 | $427 | $6,831 | $458 | $6,373 |
| 2020 | $421 | $6,818 | $458 | $6,360 |
| 2019 | $422 | $6,124 | $411 | $5,713 |
| 2018 | $409 | $5,902 | $560 | $5,342 |
| 2017 | $385 | $5,902 | $560 | $5,342 |
| 2016 | $207 | $6,348 | $619 | $5,729 |
| 2015 | $414 | $6,348 | $619 | $5,729 |
| 2014 | $403 | $6,177 | $619 | $5,558 |
Property History
| Date | Event | Price | List to Sale | Price per Sq Ft |
|---|---|---|---|---|
| 10/19/2025 10/19/25 | For Sale | $190,000 | -- | $158 / Sq Ft |
Purchase History
| Date | Type | Sale Price | Title Company |
|---|---|---|---|
| Warranty Deed | $85,000 | None Available | |
| Warranty Deed | $65,000 | Capstone Title Llc | |
| Trustee Deed | -- | None Available | |
| Deed | $5,000 | -- |
Mortgage History
| Date | Status | Loan Amount | Loan Type |
|---|---|---|---|
| Open | $86,000 | New Conventional | |
| Previous Owner | $66,838 | New Conventional |
Source: Pueblo Association of REALTORS®
MLS Number: 235248
APN: 2230-05-040
Disclaimer: Certain information contained herein is derived from information provided by parties other than Homes.com. All information provided is deemed reliable, but is not guaranteed to be accurate and should be independently verified.
![]() IDX information is provided exclusively for personal, non-commercial use, and may not be used for any purpose other than to identify prospective properties consumers may be interested in purchasing. Information is deemed reliable but not guaranteed.
IDX information is provided exclusively for personal, non-commercial use, and may not be used for any purpose other than to identify prospective properties consumers may be interested in purchasing. Information is deemed reliable but not guaranteed.
