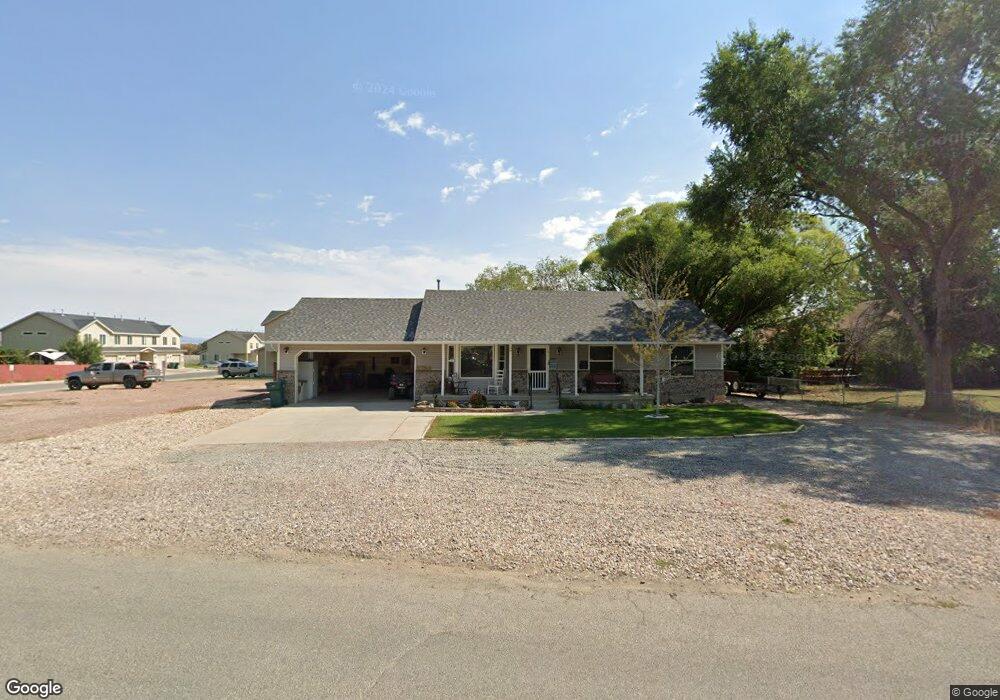
1405 S 570 E Vernal, UT 84078
Estimated Value: $349,000 - $370,000
3
Beds
2
Baths
1,334
Sq Ft
$271/Sq Ft
Est. Value
About This Home
This home is located at 1405 S 570 E, Vernal, UT 84078 and is currently estimated at $361,583, approximately $271 per square foot. 1405 S 570 E is a home located in Uintah County with nearby schools including Naples School, Vernal Middle School, and Uintah Middle School.
Ownership History
Date
Name
Owned For
Owner Type
Purchase Details
Closed on
Aug 14, 2020
Sold by
Riddle Rueben E and Kremin Codle B
Bought by
Boren James
Current Estimated Value
Home Financials for this Owner
Home Financials are based on the most recent Mortgage that was taken out on this home.
Original Mortgage
$185,250
Outstanding Balance
$163,649
Interest Rate
2.9%
Mortgage Type
New Conventional
Estimated Equity
$197,934
Purchase Details
Closed on
Dec 27, 2006
Sold by
Vangary
Bought by
Van Vangary and Van Dannette
Home Financials for this Owner
Home Financials are based on the most recent Mortgage that was taken out on this home.
Original Mortgage
$160,000
Interest Rate
6.22%
Mortgage Type
New Conventional
Purchase Details
Closed on
Apr 22, 2005
Sold by
Kummer Jeffrey Lynn
Bought by
Van Vangary and Van Dannette
Home Financials for this Owner
Home Financials are based on the most recent Mortgage that was taken out on this home.
Original Mortgage
$124,000
Interest Rate
5.99%
Mortgage Type
New Conventional
Create a Home Valuation Report for This Property
The Home Valuation Report is an in-depth analysis detailing your home's value as well as a comparison with similar homes in the area
Purchase History
| Date | Buyer | Sale Price | Title Company |
|---|---|---|---|
| Boren James | -- | None Available | |
| Van Vangary | -- | -- | |
| Vangary | -- | -- | |
| Van Vangary | -- | -- |
Source: Public Records
Mortgage History
| Date | Status | Borrower | Loan Amount |
|---|---|---|---|
| Open | Boren James | $185,250 | |
| Previous Owner | Vangary | $160,000 | |
| Previous Owner | Van Vangary | $124,000 |
Source: Public Records
Tax History
| Year | Tax Paid | Tax Assessment Tax Assessment Total Assessment is a certain percentage of the fair market value that is determined by local assessors to be the total taxable value of land and additions on the property. | Land | Improvement |
|---|---|---|---|---|
| 2024 | $1,514 | $176,352 | $20,305 | $156,047 |
| 2023 | $1,482 | $154,508 | $19,343 | $135,165 |
| 2022 | $1,315 | $127,475 | $19,343 | $108,132 |
| 2021 | $1,348 | $58,990 | $10,639 | $48,352 |
| 2020 | $1,313 | $107,255 | $19,343 | $87,912 |
| 2019 | $1,133 | $91,407 | $19,250 | $72,157 |
| 2018 | $1,088 | $87,971 | $19,250 | $68,721 |
| 2017 | $11 | $90,721 | $22,000 | $68,721 |
| 2016 | $1,046 | $92,846 | $22,000 | $70,846 |
| 2015 | $1,002 | $96,575 | $22,000 | $74,575 |
| 2014 | $991 | $96,575 | $22,000 | $74,575 |
| 2013 | $1,012 | $96,575 | $22,000 | $74,575 |
Source: Public Records
Map
Nearby Homes
- 1519 S 725 E Unit 22
- 1264 S 425 E
- 51 E 1100 S
- 15 E 1100 S
- 2066 S 500 W
- 269 E 1940 S Unit 7
- 242 E 1940 S Unit 24
- 99 E 760 S Unit B102
- 394 E 600 S Unit B
- 384 E 535 S
- 422 E 500 S Unit C
- 331 W 1500 S
- 1550 S 800 E Unit 19
- 893 S 350 W
- 819 S 300 W
- 912 S 350 W
- 303 W 2000 S
- 847 S 350 W
- 833 S 350 W
- 1105 S 500 W
Your Personal Tour Guide
Ask me questions while you tour the home.