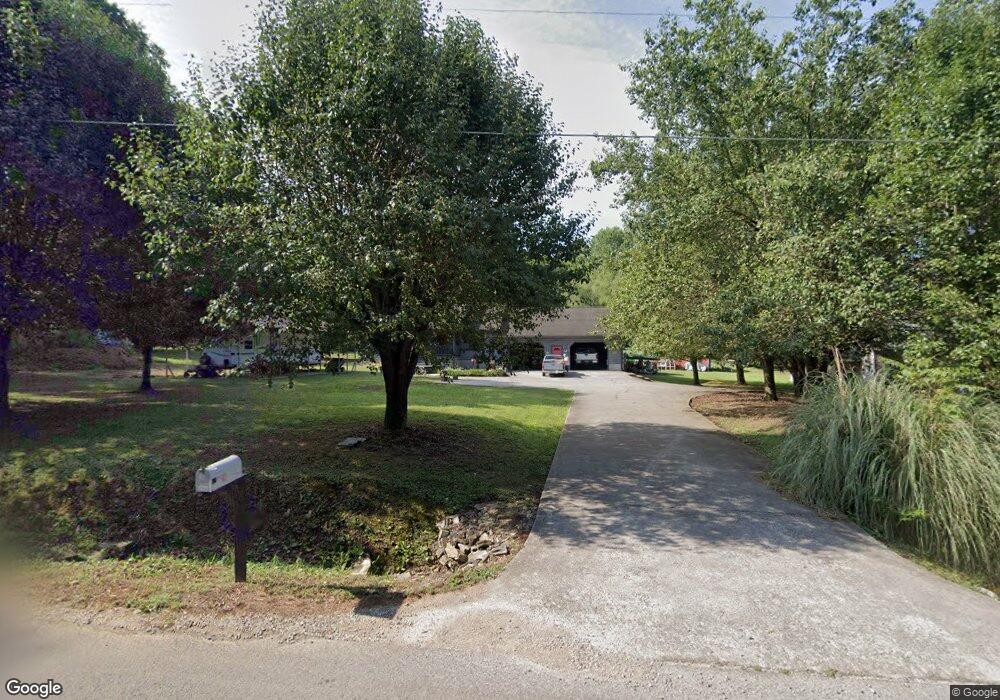
1405 Shinbone Ridge Rd La Fayette, GA 30728
Estimated Value: $196,000 - $260,000
2
Beds
2
Baths
1,280
Sq Ft
$177/Sq Ft
Est. Value
About This Home
This home is located at 1405 Shinbone Ridge Rd, La Fayette, GA 30728 and is currently estimated at $227,161, approximately $177 per square foot. 1405 Shinbone Ridge Rd is a home located in Walker County with nearby schools including Gilbert Elementary School, Lafayette Middle School, and Lafayette High School.
Ownership History
Date
Name
Owned For
Owner Type
Purchase Details
Closed on
Nov 24, 2008
Sold by
Walker Jonathon
Bought by
Wallin Clifford S
Current Estimated Value
Purchase Details
Closed on
Nov 14, 2008
Sold by
Wallin James R
Bought by
Walker Shulanda Ann
Purchase Details
Closed on
Mar 4, 2008
Sold by
Wallin Patricia A
Bought by
Walker Jonathon and Walker Shulanda Ann
Purchase Details
Closed on
Jul 9, 2007
Sold by
Wallin Patricia
Bought by
Wallin James R
Purchase Details
Closed on
Feb 5, 2007
Sold by
Wallin Patricia A
Bought by
Wallin Clifford S
Purchase Details
Closed on
Feb 4, 2000
Sold by
Burgess Charles and Burgess Shulanda
Bought by
Wallin Patricia A
Purchase Details
Closed on
Dec 8, 1997
Sold by
Wallin Patricia Ann
Bought by
Burgess Charles and Burgess Shulanda
Purchase Details
Closed on
Jan 1, 1972
Bought by
Wallin Patricia Ann
Create a Home Valuation Report for This Property
The Home Valuation Report is an in-depth analysis detailing your home's value as well as a comparison with similar homes in the area
Home Values in the Area
Average Home Value in this Area
Purchase History
| Date | Buyer | Sale Price | Title Company |
|---|---|---|---|
| Wallin Clifford S | -- | -- | |
| Wallin Patricia A | -- | -- | |
| Walker Shulanda Ann | -- | -- | |
| Walker Jonathon | -- | -- | |
| Walker Jonathon | -- | -- | |
| Wallin James R | $21,000 | -- | |
| Wallin Clifford S | -- | -- | |
| Wallin Patricia A | -- | -- | |
| Burgess Charles | -- | -- | |
| Wallin Patricia Ann | -- | -- |
Source: Public Records
Tax History Compared to Growth
Tax History
| Year | Tax Paid | Tax Assessment Tax Assessment Total Assessment is a certain percentage of the fair market value that is determined by local assessors to be the total taxable value of land and additions on the property. | Land | Improvement |
|---|---|---|---|---|
| 2024 | $1,575 | $77,167 | $3,690 | $73,477 |
| 2023 | $1,568 | $75,408 | $4,506 | $70,902 |
| 2022 | $1,432 | $63,778 | $1,839 | $61,939 |
| 2021 | $1,132 | $46,468 | $1,839 | $44,629 |
| 2020 | $982 | $39,222 | $1,839 | $37,383 |
| 2019 | $1,002 | $39,222 | $1,839 | $37,383 |
| 2018 | $1,038 | $39,222 | $1,839 | $37,383 |
| 2017 | $1,232 | $38,611 | $1,228 | $37,383 |
| 2016 | $1,026 | $38,611 | $1,228 | $37,383 |
| 2015 | $930 | $32,697 | $892 | $31,806 |
| 2014 | $899 | $35,054 | $940 | $34,114 |
| 2013 | -- | $35,054 | $940 | $34,114 |
Source: Public Records
Map
Nearby Homes
- 613 Bradley Ave
- 0 N Chattanooga St
- 1 & 3 N High St
- 212 S High St
- 0 Fortune St Unit 1520483
- 3 Fortune St
- 204 S High St
- 13 Steele St N
- 206 Glenn St
- 702.5 Henderson St
- 205 Cavender St
- 1876 Old Mineral Springs Rd
- 0 W Main St Unit 1518094
- 307 Cavender St
- 24605 Highway 193
- 301 Cedar St
- 312 Pine St
- 306 Cedar St
- 2429 Shinbone Ridge Rd
- 2400 Shinbone Ridge Rd
- 1405 Shinbone Ridge Rd
- 1395 Shinbone Ridge Rd
- 1407 Shinbone Ridge Rd
- 96 Wallin Dr
- 96 Wallin Dr
- 36 Wallin Dr
- 39 + - Acres On Shinbone Ridge Rd
- 1340 Shinbone Ridge Rd
- 1339 Shinbone Ridge Rd
- 1113 N Chattanooga St
- 1111 N Chattanooga St
- Lot 3 Bradley Ave
- 1105 N Chattanooga St Unit 1
- 1644 Shinbone Ridge Rd
- 1101 N Chattanooga St
- 505 Bradley Ave
- 1005 N Chattanooga St
- 1104 A N Chattanooga St
- 1102 N Chattanooga St
- 508 Bradley Ave