Estimated Value: $68,293 - $132,000
--
Bed
1
Bath
875
Sq Ft
$117/Sq Ft
Est. Value
About This Home
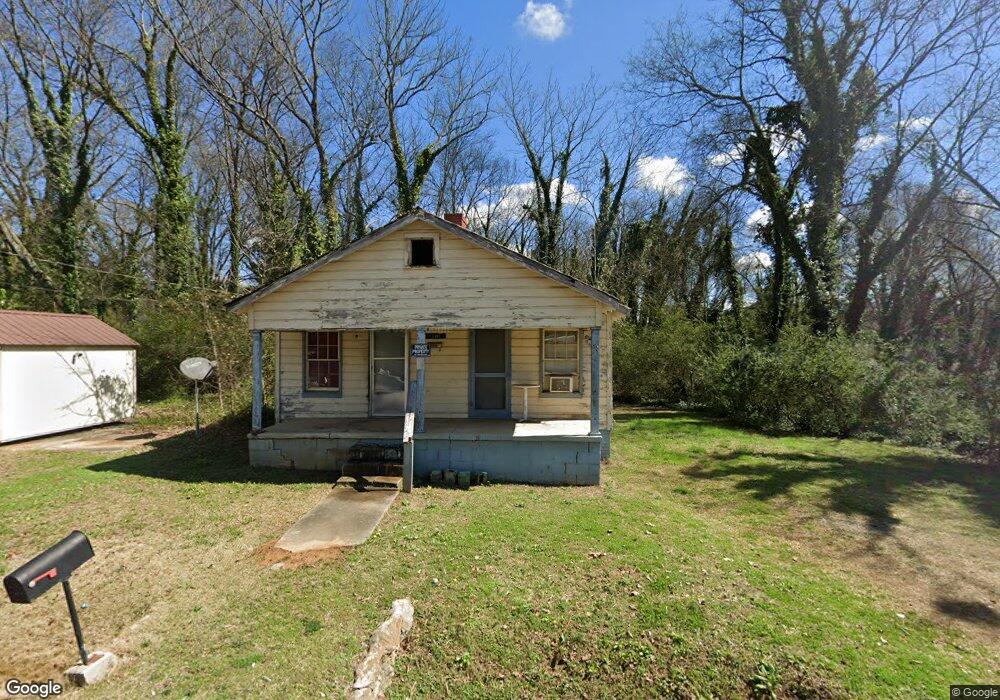
This home is located at 1405 Spring Creek St SW, Rome, GA 30161 and is currently estimated at $102,323, approximately $116 per square foot. 1405 Spring Creek St SW is a home located in Floyd County with nearby schools including Dan McCarty Middle School, Rome High School, and St. Mary School.
Ownership History
Date
Name
Owned For
Owner Type
Purchase Details
Closed on
Oct 14, 2020
Sold by
Lambert Thomas G
Bought by
Farmhouse Fireman Llc
Current Estimated Value
Purchase Details
Closed on
Aug 31, 2020
Sold by
Vonlambert Norman Von
Bought by
Lambert Thomas G
Purchase Details
Closed on
Feb 2, 1993
Sold by
Jones John Clarence
Bought by
Vonvon Lambert Norman Von and Lambe Thomas G
Purchase Details
Closed on
Jun 1, 1986
Sold by
Davidson Sherry
Bought by
Jones John Clarence
Purchase Details
Closed on
Sep 9, 1983
Sold by
N B C Of Rome
Bought by
Davidson Sherry
Purchase Details
Closed on
Feb 19, 1983
Sold by
N C B & Louise K Houser Co Exec John W H
Bought by
N B C Of Rome
Purchase Details
Closed on
Jan 1, 1981
Sold by
Houser Dr John W
Bought by
N C B & Louise K Houser Co Exec John W H
Purchase Details
Closed on
Jul 22, 1969
Sold by
Otting H T
Bought by
Houser Dr John W
Purchase Details
Closed on
Jan 1, 1901
Bought by
Otting H T
Create a Home Valuation Report for This Property
The Home Valuation Report is an in-depth analysis detailing your home's value as well as a comparison with similar homes in the area
Home Values in the Area
Average Home Value in this Area
Purchase History
| Date | Buyer | Sale Price | Title Company |
|---|---|---|---|
| Farmhouse Fireman Llc | -- | -- | |
| Lambert Thomas G | -- | -- | |
| Vonvon Lambert Norman Von | $10,000 | -- | |
| Jones John Clarence | $13,500 | -- | |
| Davidson Sherry | $6,200 | -- | |
| N B C Of Rome | $10,000 | -- | |
| N C B & Louise K Houser Co Exec John W H | -- | -- | |
| Houser Dr John W | $14,000 | -- | |
| Otting H T | -- | -- |
Source: Public Records
Tax History Compared to Growth
Tax History
| Year | Tax Paid | Tax Assessment Tax Assessment Total Assessment is a certain percentage of the fair market value that is determined by local assessors to be the total taxable value of land and additions on the property. | Land | Improvement |
|---|---|---|---|---|
| 2024 | $697 | $17,827 | $7,515 | $10,312 |
| 2023 | $631 | $16,672 | $6,832 | $9,840 |
| 2022 | $557 | $15,267 | $5,466 | $9,801 |
| 2021 | $447 | $14,176 | $5,466 | $8,710 |
| 2020 | $464 | $12,413 | $4,270 | $8,143 |
| 2019 | $439 | $11,861 | $4,270 | $7,591 |
| 2018 | $416 | $11,236 | $4,270 | $6,966 |
| 2017 | $404 | $10,901 | $4,270 | $6,631 |
| 2016 | $395 | $10,624 | $4,240 | $6,384 |
| 2015 | $373 | $10,624 | $4,240 | $6,384 |
| 2014 | $373 | $10,624 | $4,240 | $6,384 |
Source: Public Records
Map
Nearby Homes
- 4 E 15th St SW
- 1502 Spring Creek St SW
- 39 E 16th St SW
- 414 E 17th St SW
- 170 E 11th St SW
- 1705 Olmstead St SW
- 000 E Oglethorpe Hwy
- 168 E 11th St SE
- 162 E 11th St SE
- 164 E 11th St SE
- 31 Notasulga Dr SW
- 166 E 11th St SW
- 106 E 14th St SW
- 2 E 10th St SW
- 9 Eastridge Ct SW
- 1314 E 2nd Ave SE
- 304 E 19th St SW
- 211 E 11th St SE
- 303 E 15th St SW
- 301 E 15th St SW
- 305 E 15th St SW
- 402 E 14th St SW
- 307 E 15th St SW
- 404 E 14th St SW
- 1412 Spring Creek St SW
- 1410 Spring Creek St SW
- 1408 Spring Creek St SW
- 406 E 14th St SW
- 205 E 15th St SW
- 309 E 15th St SW
- 1406 Spring Creek St SW
- 408 E 14th St SW
- 2 E 15th St SW
- E E 15th St SW
- 203 E 15th St SW
- 311 E 15th St SW
- 306 E 14th St SW
- 201 E 15th St SW