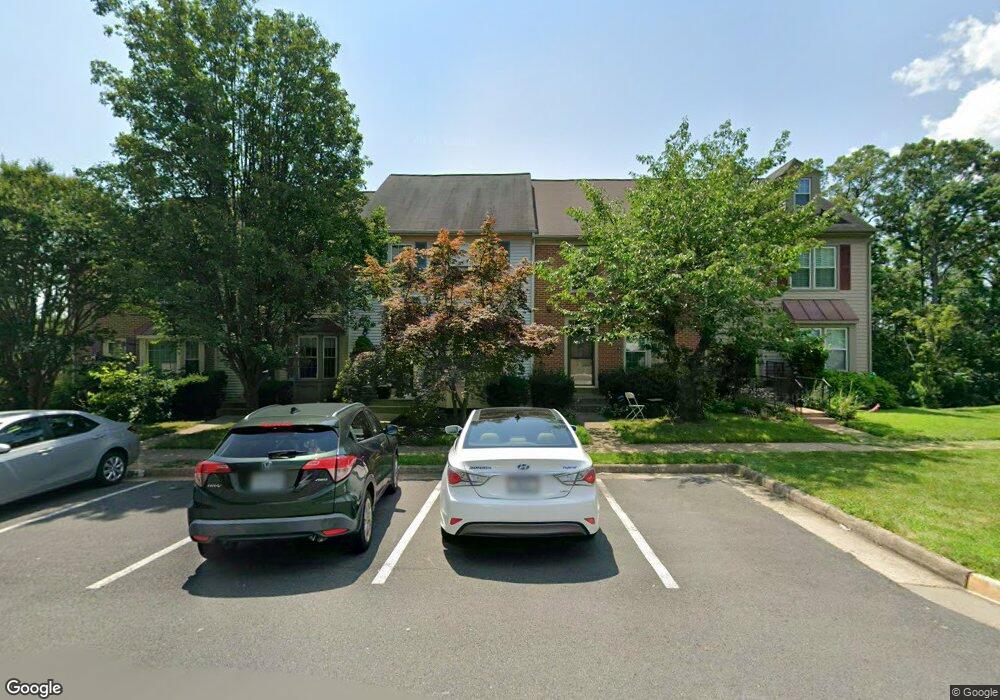
14053 Betsy Ross Ln Centreville, VA 20121
Estimated Value: $556,000 - $586,000
3
Beds
3
Baths
1,800
Sq Ft
$317/Sq Ft
Est. Value
About This Home
This home is located at 14053 Betsy Ross Ln, Centreville, VA 20121 and is currently estimated at $571,199, approximately $317 per square foot. 14053 Betsy Ross Ln is a home located in Fairfax County with nearby schools including Centreville Elementary School, Liberty Middle School, and Centreville High School.
Ownership History
Date
Name
Owned For
Owner Type
Purchase Details
Closed on
Sep 18, 2019
Sold by
Trochez Rocio D and Trochez Eddy
Bought by
Trochez Rocio D
Current Estimated Value
Purchase Details
Closed on
Nov 29, 2006
Sold by
Schutz Amanda K
Bought by
Reyes Rocio D and Trochez Eddy
Home Financials for this Owner
Home Financials are based on the most recent Mortgage that was taken out on this home.
Original Mortgage
$299,900
Interest Rate
6.36%
Mortgage Type
New Conventional
Purchase Details
Closed on
Dec 20, 2004
Sold by
Winfield Deborah L
Bought by
Schutz Amanda K
Home Financials for this Owner
Home Financials are based on the most recent Mortgage that was taken out on this home.
Original Mortgage
$284,000
Interest Rate
5.68%
Mortgage Type
New Conventional
Create a Home Valuation Report for This Property
The Home Valuation Report is an in-depth analysis detailing your home's value as well as a comparison with similar homes in the area
Home Values in the Area
Average Home Value in this Area
Purchase History
| Date | Buyer | Sale Price | Title Company |
|---|---|---|---|
| Trochez Rocio D | -- | Jdm Title Llc | |
| Reyes Rocio D | $374,900 | -- | |
| Schutz Amanda K | $355,000 | -- |
Source: Public Records
Mortgage History
| Date | Status | Borrower | Loan Amount |
|---|---|---|---|
| Previous Owner | Reyes Rocio D | $299,900 | |
| Previous Owner | Schutz Amanda K | $284,000 |
Source: Public Records
Tax History Compared to Growth
Tax History
| Year | Tax Paid | Tax Assessment Tax Assessment Total Assessment is a certain percentage of the fair market value that is determined by local assessors to be the total taxable value of land and additions on the property. | Land | Improvement |
|---|---|---|---|---|
| 2025 | $5,585 | $542,450 | $170,000 | $372,450 |
| 2024 | $5,585 | $482,130 | $140,000 | $342,130 |
| 2023 | $5,367 | $475,610 | $140,000 | $335,610 |
| 2022 | $5,005 | $437,710 | $130,000 | $307,710 |
| 2021 | $4,561 | $388,630 | $115,000 | $273,630 |
| 2020 | $4,493 | $379,650 | $110,000 | $269,650 |
| 2019 | $4,256 | $359,650 | $100,000 | $259,650 |
| 2018 | $4,081 | $354,840 | $100,000 | $254,840 |
| 2017 | $3,896 | $335,540 | $90,000 | $245,540 |
| 2016 | $3,794 | $327,520 | $85,000 | $242,520 |
| 2015 | $3,655 | $327,520 | $85,000 | $242,520 |
| 2014 | $3,434 | $308,390 | $80,000 | $228,390 |
Source: Public Records
Map
Nearby Homes
- 6309 Trevilian Place
- 6316 Mary Todd Ln
- 6311 Betsy Ross Ct
- 14079 Red River Dr
- 14102 Autumn Cir
- 14005C Grumble Jones Ct
- 14158 Darkwood Cir
- 14146 Red River Dr
- 14000 Grumble Jones Ct Unit B
- 6488 Palisades Dr
- 14159 Autumn Cir
- 13906 Big Yankee Ln
- 14002C Walter Bowie Ln
- 13875 Laura Ratcliff Ct
- 13975 Tanners House Way
- 6605 English Saddle Ct
- 6218 Stonehunt Place
- 6080 Deer Hill Ct
- 14087 Asher View
- 6036 Rockton Ct
- 14055 Betsy Ross Ln
- 14057 Betsy Ross Ln
- 14051 Betsy Ross Ln
- 14049 Betsy Ross Ln
- 14059 Betsy Ross Ln
- 14061 Betsy Ross Ln
- 14063 Betsy Ross Ln
- 14047 Betsy Ross Ln
- 14065 Betsy Ross Ln
- 14060 Betsy Ross Ln
- 14045 Betsy Ross Ln
- 14067 Betsy Ross Ln
- 14062 Betsy Ross Ln
- 14064 Betsy Ross Ln
- 14043 Betsy Ross Ln
- 14071 Betsy Ross Ln
- 14036 Betsy Ross Ln
- 14066 Betsy Ross Ln
- 14041 Betsy Ross Ln
- 14068 Betsy Ross Ln