Estimated Value: $214,000 - $298,000
--
Bed
3
Baths
1,755
Sq Ft
$145/Sq Ft
Est. Value
About This Home
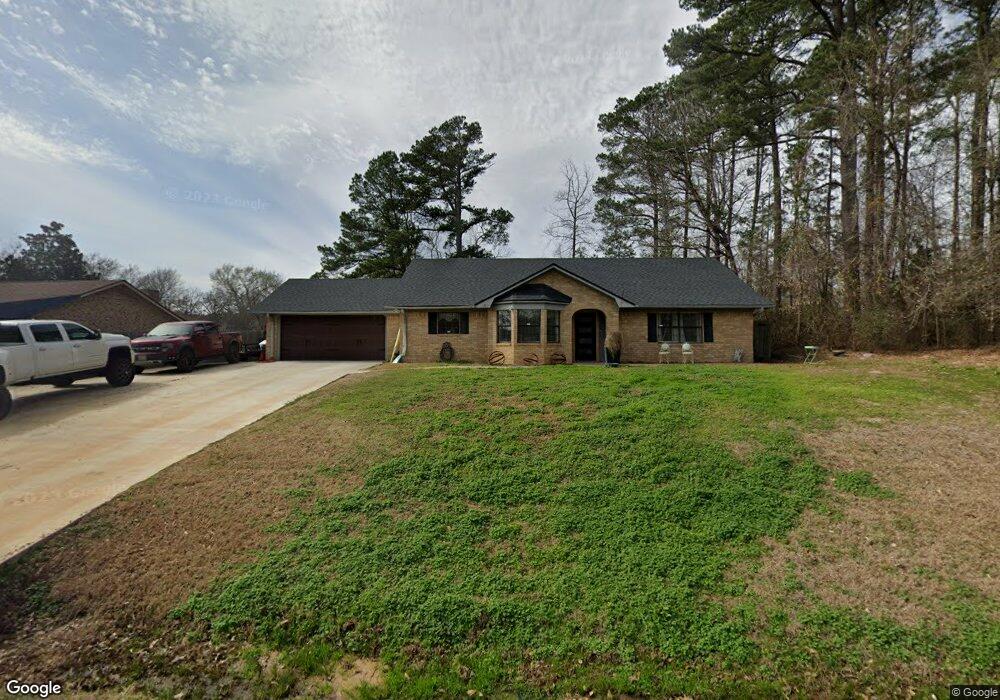
This home is located at 14059 Creekview Trail Unit TRS, Tyler, TX 75707 and is currently estimated at $253,755, approximately $144 per square foot. 14059 Creekview Trail Unit TRS is a home located in Smith County with nearby schools including Kissam Intermediate School, Jackson Elementary School, and Chapel Hill Middle School.
Ownership History
Date
Name
Owned For
Owner Type
Purchase Details
Closed on
Jun 25, 2008
Sold by
Bryant Joe B and Bryant Jannie
Bought by
Carter Allen S
Current Estimated Value
Home Financials for this Owner
Home Financials are based on the most recent Mortgage that was taken out on this home.
Original Mortgage
$127,893
Outstanding Balance
$81,711
Interest Rate
6.05%
Mortgage Type
Purchase Money Mortgage
Estimated Equity
$172,044
Purchase Details
Closed on
Jun 22, 2007
Sold by
Smith Jill Rene Socia and Smith John David
Bought by
Bryant Joe B
Home Financials for this Owner
Home Financials are based on the most recent Mortgage that was taken out on this home.
Original Mortgage
$22,560
Interest Rate
6.37%
Mortgage Type
Stand Alone Second
Create a Home Valuation Report for This Property
The Home Valuation Report is an in-depth analysis detailing your home's value as well as a comparison with similar homes in the area
Home Values in the Area
Average Home Value in this Area
Purchase History
| Date | Buyer | Sale Price | Title Company |
|---|---|---|---|
| Carter Allen S | -- | Ut | |
| Bryant Joe B | -- | Fa |
Source: Public Records
Mortgage History
| Date | Status | Borrower | Loan Amount |
|---|---|---|---|
| Open | Carter Allen S | $127,893 | |
| Previous Owner | Bryant Joe B | $22,560 | |
| Previous Owner | Bryant Joe B | $90,240 |
Source: Public Records
Tax History Compared to Growth
Tax History
| Year | Tax Paid | Tax Assessment Tax Assessment Total Assessment is a certain percentage of the fair market value that is determined by local assessors to be the total taxable value of land and additions on the property. | Land | Improvement |
|---|---|---|---|---|
| 2025 | $2,123 | $195,280 | $27,359 | $167,921 |
| 2024 | $2,123 | $186,964 | $21,626 | $170,183 |
| 2023 | $2,903 | $239,067 | $21,626 | $217,441 |
| 2022 | $2,471 | $205,484 | $14,400 | $191,084 |
| 2021 | $2,393 | $140,468 | $12,000 | $128,468 |
| 2020 | $2,464 | $140,468 | $12,000 | $128,468 |
| 2019 | $2,337 | $129,007 | $12,000 | $117,007 |
| 2018 | $2,108 | $114,294 | $12,000 | $102,294 |
| 2017 | $2,120 | $114,294 | $12,000 | $102,294 |
| 2016 | $2,080 | $112,178 | $12,000 | $100,178 |
| 2015 | $1,756 | $107,899 | $12,000 | $95,899 |
| 2014 | $1,756 | $104,449 | $12,000 | $92,449 |
Source: Public Records
Map
Nearby Homes
- 13807 County Road 220
- 13800 County Road 220
- 0000 State Highway 64
- 13594 State Highway 64 E
- 10788 County Road 225
- 13332 White Tail Dr
- 13311 White Tail Dr
- 13311 White Tail Dr Unit 1
- 13310 White Tail Dr
- 10908 & 10914 County Road 225
- 15253 State Highway 64 E
- 14951 County Road 2205
- TBD Cr 214
- 10114 C R 272
- TBD Cr 2337 Lot 4
- 13190 County Road 285
- 13200 County Road 285
- 11452 County Road 2326
- 13662 County Road 2241
- 10789 County Road 214
- 00 Creekview Trail
- 0 Creekview Trail
- 14051 Creekview Trail
- 14066 Creekview Trail
- 000 Bent Trail
- 14052 Creekview Trail
- 14060 Creekview Trail
- 13994 Bent Trail
- 13984 Bent Trail
- 14069 Creekview Trail
- 14026 Bent Trail
- 14072 Creekview Trail
- 14044 Bent Trail
- 13964 Bent Trail
- 14062 Bent Trail
- 14039 County Road 220
- 14110 Creekview Cir
- 11609 County Road 290
- 14134 Trails End
- 14134 Trail End