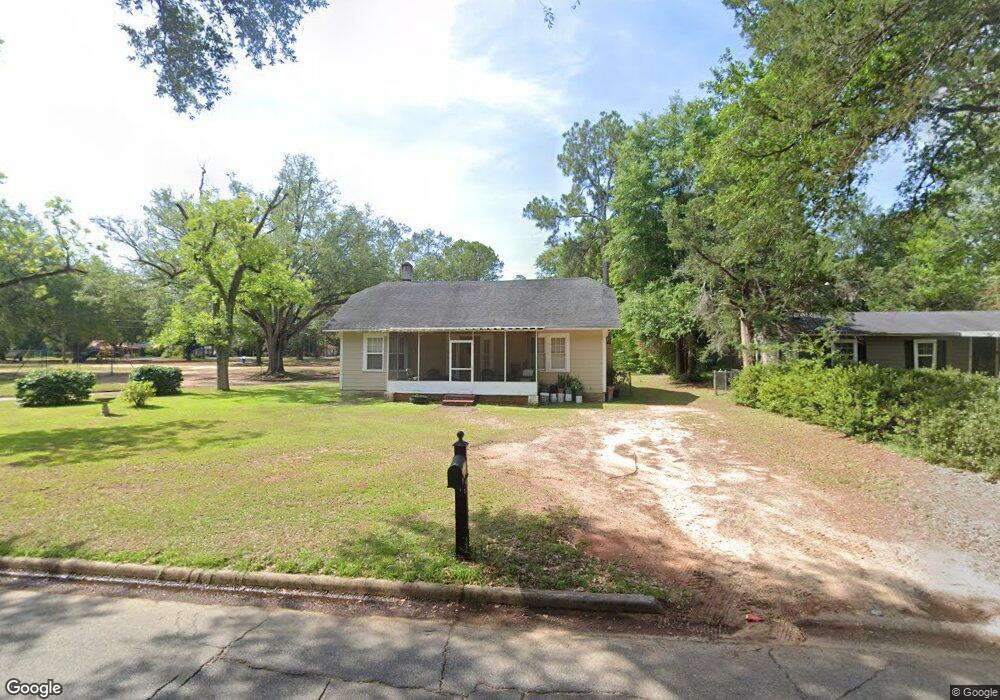
1406 Gillespie Ave Albany, GA 31707
Estimated Value: $48,000 - $121,000
3
Beds
1
Bath
1,470
Sq Ft
$45/Sq Ft
Est. Value
About This Home
This home is located at 1406 Gillespie Ave, Albany, GA 31707 and is currently estimated at $66,282, approximately $45 per square foot. 1406 Gillespie Ave is a home located in Dougherty County with nearby schools including West Town Elementary School, Southside Middle School, and Monroe High School.
Ownership History
Date
Name
Owned For
Owner Type
Purchase Details
Closed on
Oct 27, 2022
Sold by
Nobles Martha Moss
Bought by
Ella James Properties Llc
Current Estimated Value
Purchase Details
Closed on
Aug 16, 2022
Sold by
Nobles Roger Clifton
Bought by
Nobles Martha Moss
Purchase Details
Closed on
Apr 8, 2015
Sold by
Herring Carol N
Bought by
Nobles Roger C
Purchase Details
Closed on
May 29, 1995
Sold by
Nobles Richard C
Bought by
Herring Carol N and Nobles Roger C
Purchase Details
Closed on
Aug 7, 1990
Sold by
Martin Gloris E
Bought by
Nobles Richard C
Purchase Details
Closed on
Mar 1, 1990
Sold by
Nobles R C
Bought by
Martin Gloria E
Purchase Details
Closed on
Jul 28, 1969
Sold by
Ivey Carl
Bought by
Nobles R C
Create a Home Valuation Report for This Property
The Home Valuation Report is an in-depth analysis detailing your home's value as well as a comparison with similar homes in the area
Home Values in the Area
Average Home Value in this Area
Purchase History
| Date | Buyer | Sale Price | Title Company |
|---|---|---|---|
| Ella James Properties Llc | $100,000 | -- | |
| Nobles Martha Moss | -- | -- | |
| Nobles Roger C | -- | -- | |
| Herring Carol N | -- | -- | |
| Nobles Richard C | $17,200 | -- | |
| Martin Gloria E | $44,000 | -- | |
| Nobles R C | -- | -- |
Source: Public Records
Tax History Compared to Growth
Tax History
| Year | Tax Paid | Tax Assessment Tax Assessment Total Assessment is a certain percentage of the fair market value that is determined by local assessors to be the total taxable value of land and additions on the property. | Land | Improvement |
|---|---|---|---|---|
| 2024 | $840 | $17,600 | $2,560 | $15,040 |
| 2023 | $557 | $17,600 | $2,560 | $15,040 |
| 2022 | $823 | $17,600 | $2,560 | $15,040 |
| 2021 | $763 | $17,600 | $2,560 | $15,040 |
| 2020 | $765 | $17,600 | $2,560 | $15,040 |
| 2019 | $768 | $17,600 | $2,560 | $15,040 |
| 2018 | $771 | $17,600 | $2,560 | $15,040 |
| 2017 | $718 | $17,600 | $2,560 | $15,040 |
| 2016 | $719 | $17,600 | $2,560 | $15,040 |
| 2015 | $721 | $17,600 | $2,560 | $15,040 |
| 2014 | $712 | $17,600 | $2,560 | $15,040 |
Source: Public Records
Map
Nearby Homes
- 1413 Avalon Ave
- 1321 Gillespie Ave
- 1401 W Whitney Ave
- 1415 W Whitney Ave
- 1501 Avalon Ave
- 1416 Edgerly Ave
- 1227 W Lincoln Ave
- 1310 Edgerly Ave
- 1225 W Lincoln Ave
- 1408 W Gordon Ave
- 1417 W Highland Ave
- 1315 Highland Ave
- 1203 W Whitney Ave
- 1305 Highland Ave
- 1210 W Gordon Ave
- 1604 W Whitney Ave
- 1200 Highland Ave
- 1700 Edgerly Ave
- 1409 Colquitt Ave
- 1513 Colquitt Ave
- 1408 Gillespie Ave
- 1410 Gillespie Ave
- 1403 Avalon Ave
- 1405 Avalon Ave
- 1405 Gillespie Ave
- 1412 Gillespie Ave
- 1403 Gillespie Ave
- 1407 Gillespie Ave
- 1409 Avalon Ave
- 1401 Gillespie Ave
- 1409 Gillespie Ave
- 1407 Avalon Ave
- 1414 Gillespie Ave
- 1411 Gillespie Ave
- 408 Walnut St
- 1416 Gillespie Ave
- 1404 W Whitney Ave
- 1415 Gillespie Ave
- 1402 W Whitney Ave
- 1406 W Whitney Ave