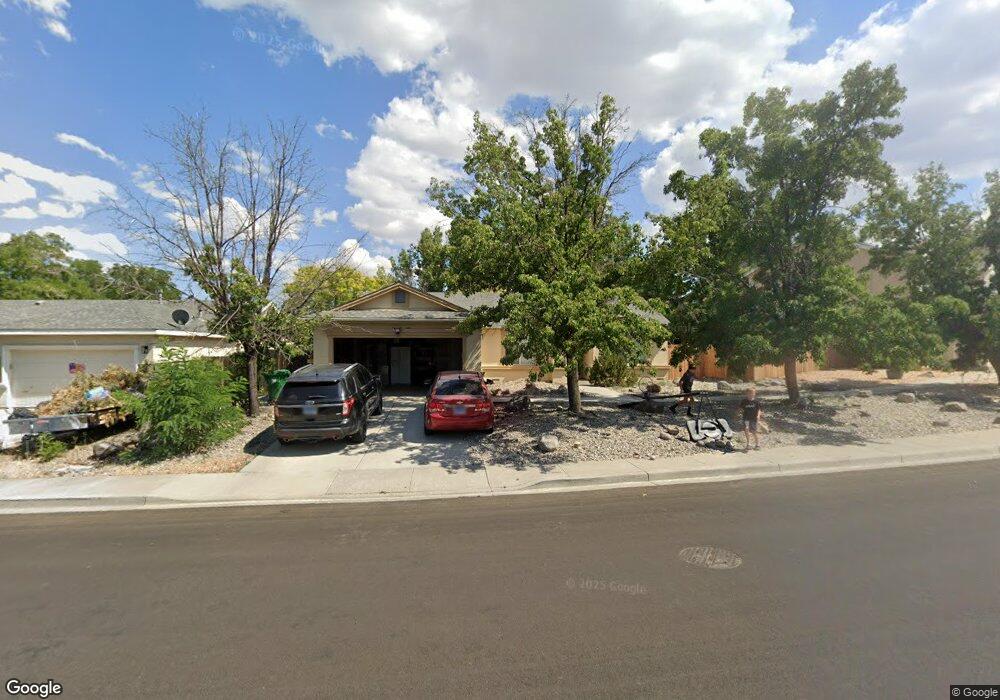
1406 Jennys Ln Fernley, NV 89408
Estimated Value: $364,191 - $392,000
3
Beds
2
Baths
1,584
Sq Ft
$238/Sq Ft
Est. Value
About This Home
This home is located at 1406 Jennys Ln, Fernley, NV 89408 and is currently estimated at $376,548, approximately $237 per square foot. 1406 Jennys Ln is a home located in Lyon County with nearby schools including Cottonwood Elementary School, Fernley Intermediate School, and Fernley High School.
Ownership History
Date
Name
Owned For
Owner Type
Purchase Details
Closed on
Nov 10, 2022
Sold by
Bode Richard I and Bode Sandra S
Bought by
Risa Holdings Llc
Current Estimated Value
Purchase Details
Closed on
Jun 6, 2014
Sold by
Bode Richard I and Bode Sandra S
Bought by
Bode Richard I and Bode Sandra S
Purchase Details
Closed on
Apr 1, 2014
Sold by
Kosky Henry J and Kosky Jennifer A
Bought by
Bode Richard I and Bode Sanda S
Purchase Details
Closed on
Jun 17, 2008
Sold by
Altman Gordon P and Altman Theresa Lynn
Bought by
Kosky Henry J and Kosky Jennifer A
Home Financials for this Owner
Home Financials are based on the most recent Mortgage that was taken out on this home.
Original Mortgage
$164,733
Interest Rate
6.31%
Mortgage Type
FHA
Purchase Details
Closed on
Oct 5, 2007
Sold by
Altman Terri Lynn and Altman Theresa Lynn
Bought by
Altman Gordon P and Altman Theresa Lynn
Create a Home Valuation Report for This Property
The Home Valuation Report is an in-depth analysis detailing your home's value as well as a comparison with similar homes in the area
Home Values in the Area
Average Home Value in this Area
Purchase History
| Date | Buyer | Sale Price | Title Company |
|---|---|---|---|
| Risa Holdings Llc | $1,720,500 | -- | |
| Bode Richard I | -- | Title Svcs And Escrow Yering | |
| Bode Richard I | $117,200 | None Available | |
| Kosky Henry J | $168,600 | Western Title Company Inc | |
| Altman Gordon P | -- | None Available | |
| Altman Terri Lynn | -- | None Available |
Source: Public Records
Mortgage History
| Date | Status | Borrower | Loan Amount |
|---|---|---|---|
| Previous Owner | Kosky Henry J | $164,733 |
Source: Public Records
Tax History Compared to Growth
Tax History
| Year | Tax Paid | Tax Assessment Tax Assessment Total Assessment is a certain percentage of the fair market value that is determined by local assessors to be the total taxable value of land and additions on the property. | Land | Improvement |
|---|---|---|---|---|
| 2025 | $1,869 | $98,562 | $43,750 | $54,812 |
| 2024 | $2,141 | $99,007 | $43,750 | $55,256 |
| 2023 | $2,141 | $95,629 | $43,750 | $51,879 |
| 2022 | $1,946 | $91,898 | $43,750 | $48,148 |
| 2021 | $1,858 | $77,840 | $30,800 | $47,040 |
| 2020 | $1,748 | $75,777 | $30,800 | $44,977 |
| 2019 | $1,682 | $71,430 | $28,000 | $43,430 |
| 2018 | $1,626 | $63,506 | $21,000 | $42,506 |
| 2017 | $1,610 | $55,719 | $13,130 | $42,589 |
| 2016 | $1,425 | $44,965 | $5,780 | $39,185 |
| 2015 | $1,460 | $29,506 | $5,780 | $23,726 |
| 2014 | $1,426 | $29,014 | $5,780 | $23,234 |
Source: Public Records
Map
Nearby Homes
- 1409 Jennys Ln
- 1563 Maria Ct
- 1740 Johns Cir
- 1625 Picetti Way
- 1285 Camille Dr
- 1165 Jenny's Ln
- 1300 Rancho Rd
- 1671 Vista Moon Ct
- 1315 Winnies Ln
- 1616 Laverder Dr
- 1353 Winnies Ln
- 1405 Buckboard Way
- 1240-1250 Farm District Rd
- 2605 Emerson Cir
- 675 Warren Way
- 870 Jennys Ln
- 1165 Farm Ln
- 863 Jennys Ln
- 698 Jenny's Ln
- 636 Brook Ln
- 1426 Jennys Ln
- 1400 Jennys Ln
- 1601 Picetti Way
- 1946 Rawles Dr Unit 4
- 1946 W Rawles Dr
- 1942 Rawles Dr
- 1942 W Rawles Dr
- 1555 Picetti Ct
- 1481 Jennys Ln
- 1471 Jenny's Ln Unit Lot 1005
- 1950 Rawles Dr
- 1950 W Rawles Dr
- 1423 Jenny's Ln
- 1603 Picetti Way
- 1423 Jennys Ln
- 1531 Picetti Ct
- 1954 Rawles Dr Unit 6
- 1954 W Rawles Dr
- 1431 Jennys Ln
- 1600 Picetti Way