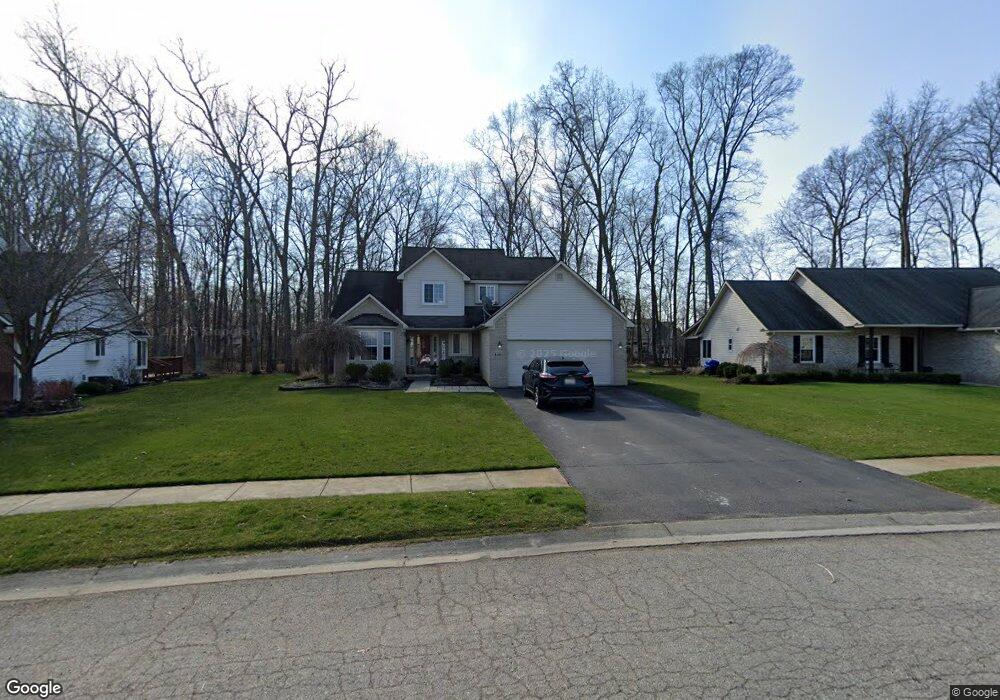
1406 Remsing St Unit 44 Hartland, MI 48353
Estimated Value: $394,982 - $473,000
3
Beds
4
Baths
1,726
Sq Ft
$248/Sq Ft
Est. Value
About This Home
This home is located at 1406 Remsing St Unit 44, Hartland, MI 48353 and is currently estimated at $427,746, approximately $247 per square foot. 1406 Remsing St Unit 44 is a home located in Livingston County with nearby schools including Hartland High School, Charyl Stockwell Academy, and Our Savior Evangelical Lutheran School.
Ownership History
Date
Name
Owned For
Owner Type
Purchase Details
Closed on
May 28, 2015
Sold by
Robinson Stephen J and Robinson Kimberly
Bought by
Poloni Gregory and Poloni Molly
Current Estimated Value
Purchase Details
Closed on
Apr 14, 2000
Sold by
Hartland Lakes Estates
Bought by
St Dennis Development Inc
Home Financials for this Owner
Home Financials are based on the most recent Mortgage that was taken out on this home.
Original Mortgage
$155,775
Interest Rate
8.21%
Mortgage Type
Construction
Purchase Details
Closed on
Aug 18, 1900
Sold by
St Dennis Development Inc
Bought by
Robinson Stephen J and Robinson Kimberly
Create a Home Valuation Report for This Property
The Home Valuation Report is an in-depth analysis detailing your home's value as well as a comparison with similar homes in the area
Home Values in the Area
Average Home Value in this Area
Purchase History
| Date | Buyer | Sale Price | Title Company |
|---|---|---|---|
| Poloni Gregory | $249,900 | Liberty Title Agency | |
| St Dennis Development Inc | $48,403 | Tri Country Title Agency Inc | |
| Robinson Stephen J | $45,000 | -- |
Source: Public Records
Mortgage History
| Date | Status | Borrower | Loan Amount |
|---|---|---|---|
| Previous Owner | St Dennis Development Inc | $155,775 |
Source: Public Records
Tax History Compared to Growth
Tax History
| Year | Tax Paid | Tax Assessment Tax Assessment Total Assessment is a certain percentage of the fair market value that is determined by local assessors to be the total taxable value of land and additions on the property. | Land | Improvement |
|---|---|---|---|---|
| 2025 | $4,056 | $170,200 | $0 | $0 |
| 2024 | $1,756 | $182,100 | $0 | $0 |
| 2023 | $1,679 | $140,800 | $0 | $0 |
| 2022 | $3,683 | $119,500 | $0 | $0 |
| 2021 | $3,534 | $134,500 | $0 | $0 |
| 2020 | $3,521 | $129,100 | $0 | $0 |
| 2019 | $3,333 | $119,500 | $0 | $0 |
| 2018 | $3,314 | $120,900 | $0 | $0 |
| 2017 | $3,289 | $120,900 | $0 | $0 |
| 2016 | $3,972 | $117,400 | $0 | $0 |
| 2014 | -- | $91,900 | $0 | $0 |
| 2012 | -- | $88,700 | $0 | $0 |
Source: Public Records
Map
Nearby Homes
- 1441 Remsing St Unit 4
- 1560 Odette
- 11639 Island Ct
- V/L Highland Rd
- 1020 Woods Edge Dr
- 12002 Renfrew Ct
- 1163 Long Lake Dr
- 2255 Clark Rd
- 1412 North Ct
- 2.03 Acres Highland Rd
- 2581 Pepper Ct
- 12071 Highland Rd
- V/L Parcel D Old Us-23 Hwy
- V/L Parcels C & D Old Us-23 Hwy
- V/L Parcel C Old Us-23 Hwy
- 000 Highland Rd
- 10456 Viewtop Ct
- Chase Plan at Hunters Ridge - Landings 5
- Beretta Loft Plan at Hunters Ridge - Landings 5
- Beretta Plan at Hunters Ridge - Landings 5
- 1398 Remsing St Unit 43
- 1390 Remsing St Unit 42
- 1422 Remsing St Unit 46
- 1401 Remsing St Unit Bldg-Unit
- 1401 Remsing St Unit 9
- 1409 Remsing St Unit 8
- 1393 Remsing St Unit 10
- 1435 Odette Unit 35
- 1427 Odette Unit 36
- 1436 Remsing St Unit 47
- 1417 Remsing St Unit 7
- 1378 Remsing St Unit 41
- 1419 Odette Unit 37
- 1411 Odette Unit 38
- 1443 Odette Unit 34
- 1385 Remsing St Unit 11
- 1425 Remsing St Unit 6
- 1403 Odette
- 1444 Remsing St Unit 48
- 1451 Odette Unit 33