1406 SE 17th St Unit 17 Cape Coral, FL 33990
Hancock NeighborhoodEstimated Value: $309,200 - $366,000
4
Beds
2
Baths
1,710
Sq Ft
$200/Sq Ft
Est. Value
About This Home
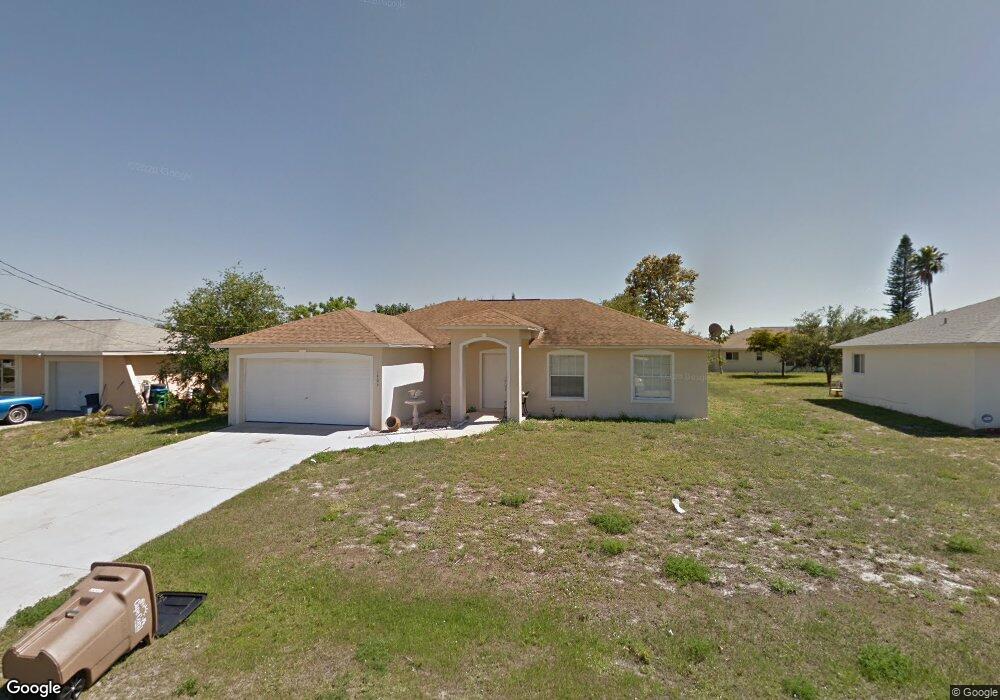
This home is located at 1406 SE 17th St Unit 17, Cape Coral, FL 33990 and is currently estimated at $342,050, approximately $200 per square foot. 1406 SE 17th St Unit 17 is a home located in Lee County with nearby schools including Caloosa Elementary School, Cape Elementary School, and Tropic Isles Elementary School.
Ownership History
Date
Name
Owned For
Owner Type
Purchase Details
Closed on
Dec 16, 2009
Sold by
Shrake Kenneth
Bought by
Lascelles Ronald
Current Estimated Value
Purchase Details
Closed on
Dec 4, 2009
Sold by
Rodriguez Ana Martes
Bought by
Shrake Kenneth
Purchase Details
Closed on
Aug 8, 2005
Sold by
Turnstone Enterprises Inc
Bought by
Rodriguez Ana Martes and Martes Jose A
Home Financials for this Owner
Home Financials are based on the most recent Mortgage that was taken out on this home.
Original Mortgage
$239,920
Interest Rate
1.37%
Mortgage Type
New Conventional
Purchase Details
Closed on
Jan 15, 2004
Sold by
Excel Const S W Fl Inc
Bought by
Turnstone Ent Inc
Purchase Details
Closed on
Dec 17, 2003
Sold by
Dlugash Jack L and Dlugash Regina
Bought by
Wood Christina M
Create a Home Valuation Report for This Property
The Home Valuation Report is an in-depth analysis detailing your home's value as well as a comparison with similar homes in the area
Home Values in the Area
Average Home Value in this Area
Purchase History
| Date | Buyer | Sale Price | Title Company |
|---|---|---|---|
| Lascelles Ronald | -- | None Available | |
| Shrake Kenneth | $73,600 | None Available | |
| Rodriguez Ana Martes | $299,900 | First Cmnty Title Svcs Inc | |
| Turnstone Ent Inc | -- | -- | |
| Excel Const Sw Fl Inc | $42,900 | -- | |
| Excel Const Sw Fl Inc | $33,500 | -- | |
| Wood Christina M | $27,000 | -- |
Source: Public Records
Mortgage History
| Date | Status | Borrower | Loan Amount |
|---|---|---|---|
| Previous Owner | Rodriguez Ana Martes | $239,920 |
Source: Public Records
Tax History Compared to Growth
Tax History
| Year | Tax Paid | Tax Assessment Tax Assessment Total Assessment is a certain percentage of the fair market value that is determined by local assessors to be the total taxable value of land and additions on the property. | Land | Improvement |
|---|---|---|---|---|
| 2025 | $5,122 | $258,875 | $66,215 | $192,660 |
| 2024 | $6,092 | $271,430 | $58,470 | $212,960 |
| 2023 | $6,092 | $333,268 | $68,843 | $264,425 |
| 2022 | $4,169 | $200,306 | $0 | $0 |
| 2021 | $3,731 | $182,270 | $31,500 | $150,770 |
| 2020 | $3,544 | $165,542 | $28,750 | $136,792 |
| 2019 | $3,358 | $156,662 | $25,000 | $131,662 |
| 2018 | $3,428 | $157,455 | $25,000 | $132,455 |
| 2017 | $3,255 | $161,495 | $17,000 | $144,495 |
| 2016 | $2,937 | $136,910 | $17,000 | $119,910 |
| 2015 | $2,700 | $118,396 | $14,000 | $104,396 |
| 2014 | $2,563 | $116,397 | $11,280 | $105,117 |
| 2013 | -- | $100,903 | $10,800 | $90,103 |
Source: Public Records
Map
Nearby Homes
- 1405 SE 17th St
- 1439 SE 18th St
- 1447 SE 17th Terrace
- 1512 SE 17th Terrace
- 1449 SE 16th St
- 1222 SE 18th Terrace
- 1314 SE 15th Terrace
- 1806 SE 15th Place
- 1433 SE 19th Terrace
- 1404 SE 15th St
- 1215 SE 16th St
- 1453 SE 15th Terrace
- 1902 SE 15th Place
- 1122 SE 19th St
- 1104 SE 16th Terrace
- 1421 SE 14th Terrace
- 1220 SE 19th Ln
- 1105 SE 17th Terrace
- 1318 SE 14th St
- 1103 SE 18th St
- 1406 SE 17th St
- 1410 SE 17th St
- 1402 SE 17th St
- 1411 SE 17th Terrace
- 1414 SE 17th St
- 1328 SE 17th St
- 1415 SE 17th Terrace
- 1409 SE 17th St
- 1419 SE 17th Terrace
- 1403 SE 17th Terrace
- 1401 SE 17th St
- 1418 SE 17th St
- 1324 SE 17th St
- 1327 SE 17th St
- 1323 SE 17th Terrace
- 1423 SE 17th Terrace
- 1417 SE 17th St
- 1412 SE 17th Terrace
- 1416 SE 17th Terrace
- 1408 SE 17th Terrace