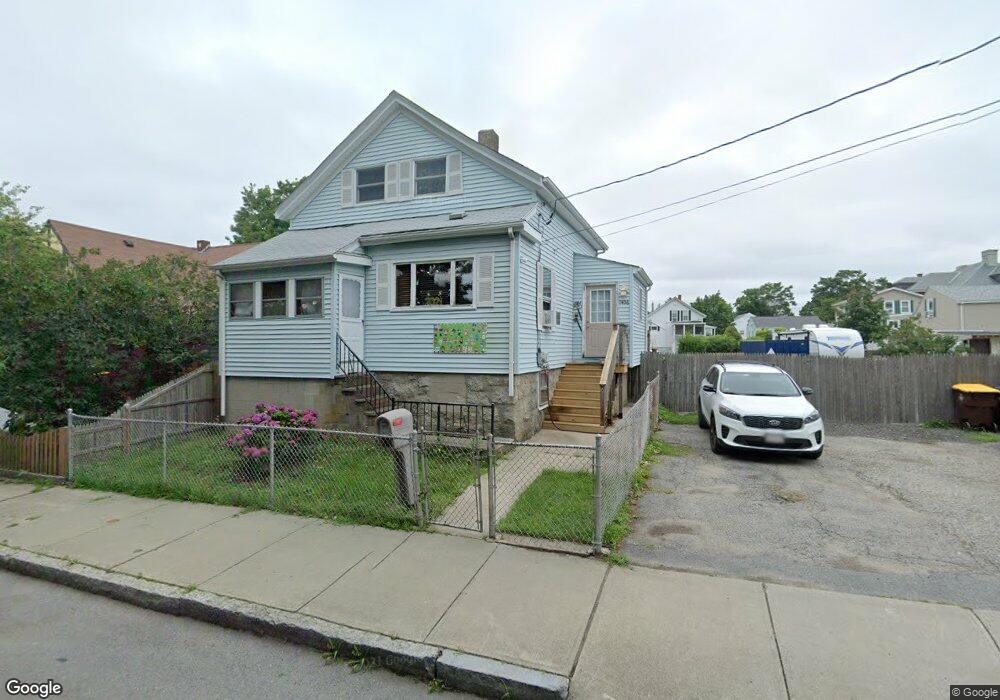
1406 Slade St Fall River, MA 02721
Maplewood NeighborhoodEstimated Value: $319,000 - $388,000
4
Beds
1
Bath
919
Sq Ft
$386/Sq Ft
Est. Value
About This Home
This home is located at 1406 Slade St, Fall River, MA 02721 and is currently estimated at $355,193, approximately $386 per square foot. 1406 Slade St is a home located in Bristol County with nearby schools including Letourneau Elementary School, Matthew J. Kuss Middle School, and B M C Durfee High School.
Ownership History
Date
Name
Owned For
Owner Type
Purchase Details
Closed on
Mar 9, 2006
Sold by
Coelho Dorothy
Bought by
Santos Carrie A and Santos Jonathan J
Current Estimated Value
Home Financials for this Owner
Home Financials are based on the most recent Mortgage that was taken out on this home.
Original Mortgage
$183,400
Outstanding Balance
$103,528
Interest Rate
6.15%
Mortgage Type
Purchase Money Mortgage
Estimated Equity
$251,665
Create a Home Valuation Report for This Property
The Home Valuation Report is an in-depth analysis detailing your home's value as well as a comparison with similar homes in the area
Home Values in the Area
Average Home Value in this Area
Purchase History
| Date | Buyer | Sale Price | Title Company |
|---|---|---|---|
| Santos Carrie A | $190,200 | -- |
Source: Public Records
Mortgage History
| Date | Status | Borrower | Loan Amount |
|---|---|---|---|
| Open | Santos Carrie A | $183,400 |
Source: Public Records
Tax History
| Year | Tax Paid | Tax Assessment Tax Assessment Total Assessment is a certain percentage of the fair market value that is determined by local assessors to be the total taxable value of land and additions on the property. | Land | Improvement |
|---|---|---|---|---|
| 2025 | $3,152 | $275,300 | $112,500 | $162,800 |
| 2024 | $2,993 | $260,500 | $108,400 | $152,100 |
| 2023 | $2,855 | $232,700 | $89,500 | $143,200 |
| 2022 | $2,607 | $206,600 | $85,300 | $121,300 |
| 2021 | $4,301 | $181,900 | $81,100 | $100,800 |
| 2020 | $2,416 | $167,200 | $79,900 | $87,300 |
| 2019 | $2,350 | $161,200 | $77,000 | $84,200 |
| 2018 | $4,150 | $166,200 | $83,400 | $82,800 |
| 2017 | $2,253 | $160,900 | $79,500 | $81,400 |
| 2016 | $2,212 | $162,300 | $84,600 | $77,700 |
| 2015 | $2,162 | $165,300 | $84,600 | $80,700 |
| 2014 | $2,048 | $162,800 | $82,100 | $80,700 |
Source: Public Records
Map
Nearby Homes
Your Personal Tour Guide
Ask me questions while you tour the home.