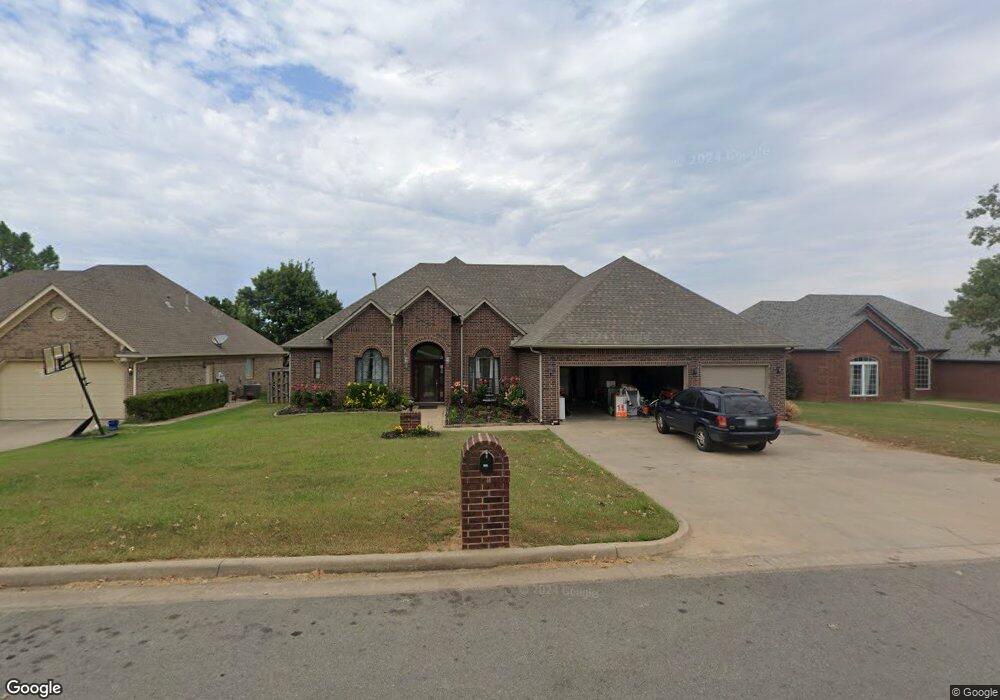
1406 Sterling St Fort Gibson, OK 74434
Estimated Value: $381,000 - $521,000
4
Beds
3
Baths
2,647
Sq Ft
$171/Sq Ft
Est. Value
About This Home
This home is located at 1406 Sterling St, Fort Gibson, OK 74434 and is currently estimated at $453,626, approximately $171 per square foot. 1406 Sterling St is a home located in Muskogee County with nearby schools including Fort Gibson Early Learning Center, Fort Gibson Intermediate Elementary School, and Fort Gibson Middle School.
Ownership History
Date
Name
Owned For
Owner Type
Purchase Details
Closed on
Jan 23, 2025
Sold by
Lehman Benjamin F
Bought by
Fiedler Sherriel
Current Estimated Value
Home Financials for this Owner
Home Financials are based on the most recent Mortgage that was taken out on this home.
Original Mortgage
$185,840
Outstanding Balance
$184,527
Interest Rate
6.72%
Mortgage Type
FHA
Estimated Equity
$269,099
Purchase Details
Closed on
Jun 27, 2012
Sold by
Stacie Jones James Eric and Stacie Broyz Jones
Bought by
Lehman Benjamin F
Home Financials for this Owner
Home Financials are based on the most recent Mortgage that was taken out on this home.
Original Mortgage
$250,760
Interest Rate
3.72%
Mortgage Type
Purchase Money Mortgage
Purchase Details
Closed on
Feb 1, 1999
Purchase Details
Closed on
Aug 1, 1993
Create a Home Valuation Report for This Property
The Home Valuation Report is an in-depth analysis detailing your home's value as well as a comparison with similar homes in the area
Home Values in the Area
Average Home Value in this Area
Purchase History
| Date | Buyer | Sale Price | Title Company |
|---|---|---|---|
| Fiedler Sherriel | -- | Pioneer Abstract | |
| Lehman Benjamin F | -- | None Available | |
| -- | $14,000 | -- | |
| -- | -- | -- |
Source: Public Records
Mortgage History
| Date | Status | Borrower | Loan Amount |
|---|---|---|---|
| Open | Fiedler Sherriel | $185,840 | |
| Previous Owner | Lehman Benjamin F | $250,760 |
Source: Public Records
Tax History Compared to Growth
Tax History
| Year | Tax Paid | Tax Assessment Tax Assessment Total Assessment is a certain percentage of the fair market value that is determined by local assessors to be the total taxable value of land and additions on the property. | Land | Improvement |
|---|---|---|---|---|
| 2025 | $3,206 | $39,033 | $1,694 | $37,339 |
| 2024 | $3,206 | $37,174 | $1,613 | $35,561 |
| 2023 | $3,206 | $35,403 | $1,272 | $34,131 |
| 2022 | $2,900 | $35,403 | $1,272 | $34,131 |
| 2021 | $2,766 | $32,521 | $1,595 | $30,926 |
| 2020 | $2,784 | $32,521 | $1,595 | $30,926 |
| 2019 | $2,806 | $32,522 | $1,595 | $30,927 |
| 2018 | $2,805 | $32,522 | $1,595 | $30,927 |
| 2017 | $2,788 | $32,513 | $1,595 | $30,918 |
| 2016 | $2,903 | $32,513 | $1,595 | $30,918 |
| 2015 | $2,907 | $32,513 | $1,595 | $30,918 |
| 2014 | $2,919 | $32,513 | $1,595 | $30,918 |
Source: Public Records
Map
Nearby Homes
- 607 Sterling Hill Dr
- 1409 Sterling Ct
- 602 Cemetery Rd
- 121 N Meigs St
- 105 N Firecracker Ln
- 1003 E Maple St
- 313 S Meigs St
- 308 N East St
- 608 E Irving
- 604 Irving St
- 305 E Hickory Ave
- 301 E Poplar St
- 0 E Coppinger Ave
- 125 E Walnut St
- 1412 Richmond Dr
- 513 Beauregard St
- 313 E Ash Ave
- 1100 Hwy 10e
- W 805 Rd
- 608 N Lee St
- 1412 Sterling St
- 1410 Sterling St
- 1408 Sterling St
- 1406 Sterling St
- 1404 Sterling St
- 1400 Sterling St
- 713 N Willey St
- 725 N Willey St
- 721 N Willey St
- 717 N Willey St
- 1413 Sterling St
- 1411 Sterling St
- 1409 Sterling St
- 1405 Sterling St
- 1403 Sterling St
- 1401 Sterling St
- 711 N Willey St
- 709 N Willey St
- 903 N Willey St
- 608 Sterling Hill Dr