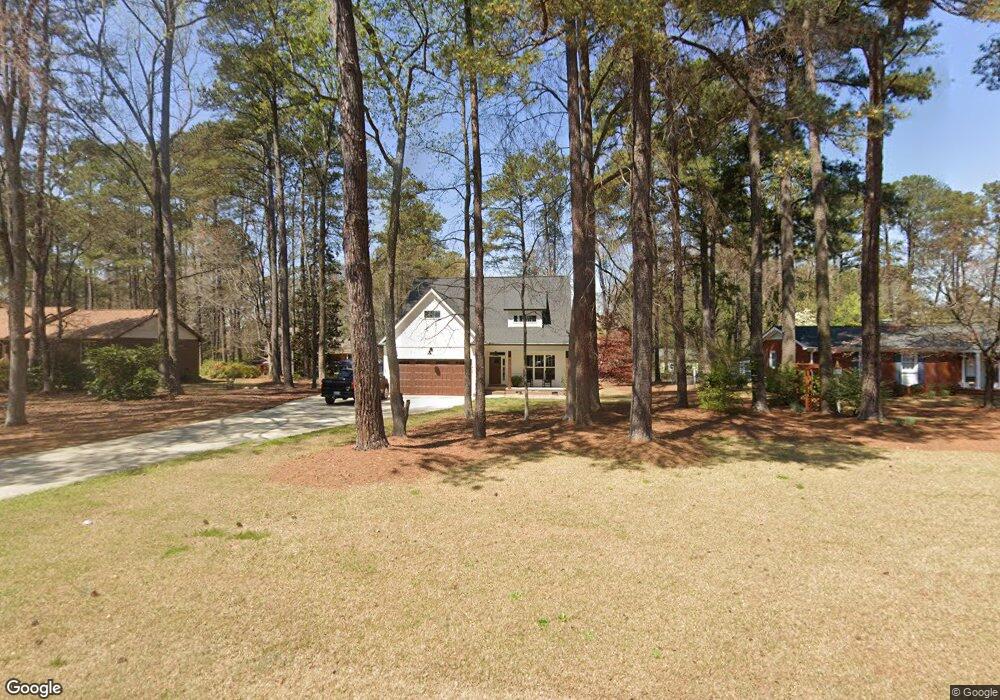
1406 Vandora Springs Rd Garner, NC 27529
Estimated Value: $470,000 - $495,000
4
Beds
3
Baths
1,967
Sq Ft
$245/Sq Ft
Est. Value
About This Home
This home is located at 1406 Vandora Springs Rd, Garner, NC 27529 and is currently estimated at $482,322, approximately $245 per square foot. 1406 Vandora Springs Rd is a home located in Wake County with nearby schools including Vandora Springs Elementary, North Garner Middle, and Garner High.
Ownership History
Date
Name
Owned For
Owner Type
Purchase Details
Closed on
Oct 24, 2019
Sold by
S & D Builders Inc
Bought by
Rigney Melissa A
Current Estimated Value
Home Financials for this Owner
Home Financials are based on the most recent Mortgage that was taken out on this home.
Original Mortgage
$291,900
Outstanding Balance
$260,079
Interest Rate
4.37%
Mortgage Type
New Conventional
Estimated Equity
$222,243
Purchase Details
Closed on
Oct 23, 2019
Sold by
S & D Builders Inc
Bought by
Rigney Melissa A
Home Financials for this Owner
Home Financials are based on the most recent Mortgage that was taken out on this home.
Original Mortgage
$291,900
Outstanding Balance
$260,079
Interest Rate
4.37%
Mortgage Type
New Conventional
Estimated Equity
$222,243
Purchase Details
Closed on
Feb 28, 2019
Sold by
Harvin Robert T and Harvln Judy D
Bought by
S & D Builders Inc
Purchase Details
Closed on
Feb 5, 2007
Sold by
Montague Inez H and Montague Bert M
Bought by
Harvin Robert L and Harvin Judy D
Create a Home Valuation Report for This Property
The Home Valuation Report is an in-depth analysis detailing your home's value as well as a comparison with similar homes in the area
Home Values in the Area
Average Home Value in this Area
Purchase History
| Date | Buyer | Sale Price | Title Company |
|---|---|---|---|
| Rigney Melissa A | $290,000 | None Available | |
| Rigney Melissa A | $290,000 | None Listed On Document | |
| S & D Builders Inc | $45,500 | None Available | |
| Harvin Robert L | $32,500 | None Available |
Source: Public Records
Mortgage History
| Date | Status | Borrower | Loan Amount |
|---|---|---|---|
| Open | Rigney Melissa A | $291,900 | |
| Closed | Rigney Melissa A | $291,900 |
Source: Public Records
Tax History Compared to Growth
Tax History
| Year | Tax Paid | Tax Assessment Tax Assessment Total Assessment is a certain percentage of the fair market value that is determined by local assessors to be the total taxable value of land and additions on the property. | Land | Improvement |
|---|---|---|---|---|
| 2025 | $5,024 | $482,518 | $110,000 | $372,518 |
| 2024 | $5,007 | $482,518 | $110,000 | $372,518 |
| 2023 | $3,983 | $308,609 | $50,000 | $258,609 |
| 2022 | $3,636 | $308,609 | $50,000 | $258,609 |
| 2021 | $3,452 | $308,609 | $50,000 | $258,609 |
| 2020 | $3,406 | $308,609 | $50,000 | $258,609 |
| 2019 | $346 | $27,000 | $27,000 | $0 |
| 2018 | $320 | $27,000 | $27,000 | $0 |
| 2017 | $310 | $27,000 | $27,000 | $0 |
| 2016 | $306 | $27,000 | $27,000 | $0 |
| 2015 | $475 | $42,000 | $42,000 | $0 |
| 2014 | $453 | $42,000 | $42,000 | $0 |
Source: Public Records
Map
Nearby Homes
- 1326 Vandora Springs Rd
- 1320 Pineview Dr
- 220 Grand Pointe Dr
- 428 Grand Pointe Dr Unit 803
- 1607 Sycamore Dr
- 109 Hiddenwood Ct
- 1101 Park Ave
- 1882 Lennox Dr
- 103 Stonecutter Ct
- 1200 Poole Dr
- 704 Topleaf Ct
- 107 Binford Ct
- 1003 Buckhorn Rd
- 113 Stonecutter Ct
- 826 Oakwater Dr
- 113 Heatherwood Dr
- 603 Nellane Dr
- 5716 Spring Rd
- 1308 Claymore Dr
- 914 Forest Dr
- 1404 Vandora Springs Rd
- 1408 Vandora Springs Rd
- 1407 Pineview Dr
- 1405 Pineview Dr
- 1407 Vandora Springs Rd
- 1409 Vandora Springs Rd
- 1415 Pineview Dr
- 1400 Vandora Springs Rd
- 1403 Vandora Springs Rd
- 1412 Vandora Springs Rd
- 1417 Pineview Dr
- 1401 Pineview Dr
- 1401 Vandora Springs Rd
- 1413 Vandora Springs Rd
- 1406 Kennon Rd
- 1404 Kennon Rd
- 1606 Vandora Springs Rd
- 0 Vandora Springs Rd
- 1330 Vandora Springs Rd
- 1408 Kennon Rd