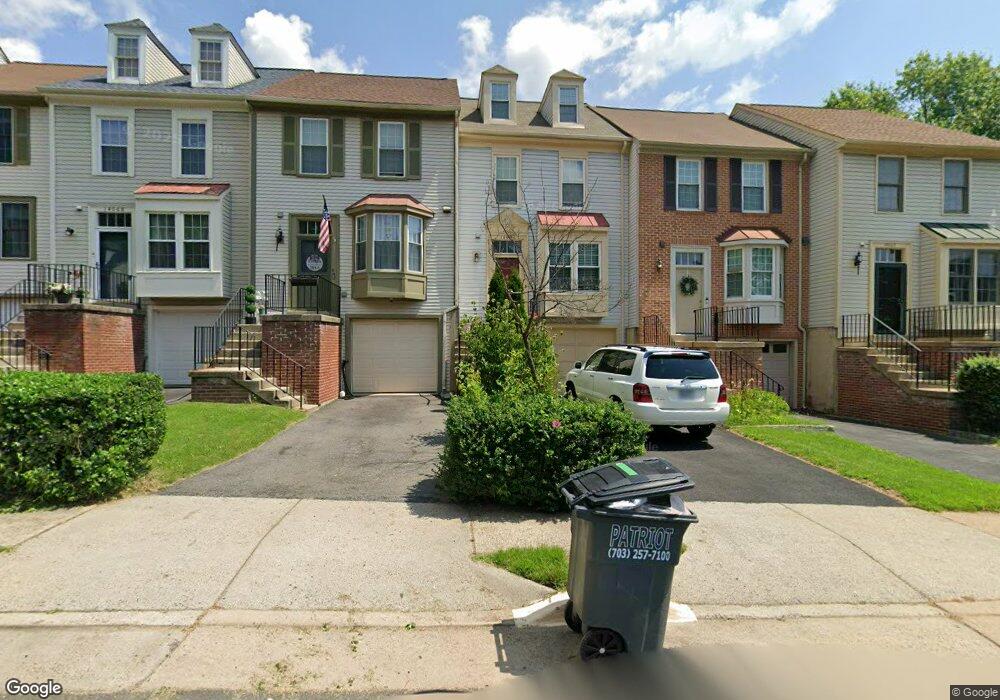
14064 Betsy Ross Ln Centreville, VA 20121
Estimated Value: $574,000 - $590,000
3
Beds
4
Baths
1,492
Sq Ft
$389/Sq Ft
Est. Value
About This Home
This home is located at 14064 Betsy Ross Ln, Centreville, VA 20121 and is currently estimated at $579,995, approximately $388 per square foot. 14064 Betsy Ross Ln is a home located in Fairfax County with nearby schools including Centreville Elementary School, Liberty Middle School, and Centreville High School.
Ownership History
Date
Name
Owned For
Owner Type
Purchase Details
Closed on
Nov 4, 2005
Sold by
Zabala Felisa C
Bought by
Argueta Francisco J and Alvarado Angela A
Current Estimated Value
Home Financials for this Owner
Home Financials are based on the most recent Mortgage that was taken out on this home.
Original Mortgage
$316,000
Outstanding Balance
$171,126
Interest Rate
5.85%
Mortgage Type
New Conventional
Estimated Equity
$408,869
Purchase Details
Closed on
Nov 4, 2003
Sold by
Masumi Banazir
Bought by
Zabala Felisa C
Home Financials for this Owner
Home Financials are based on the most recent Mortgage that was taken out on this home.
Original Mortgage
$261,155
Interest Rate
6.05%
Mortgage Type
New Conventional
Purchase Details
Closed on
Apr 29, 1996
Sold by
Fields James S
Bought by
Masumi Sayed H
Home Financials for this Owner
Home Financials are based on the most recent Mortgage that was taken out on this home.
Original Mortgage
$127,914
Interest Rate
7.81%
Create a Home Valuation Report for This Property
The Home Valuation Report is an in-depth analysis detailing your home's value as well as a comparison with similar homes in the area
Home Values in the Area
Average Home Value in this Area
Purchase History
| Date | Buyer | Sale Price | Title Company |
|---|---|---|---|
| Argueta Francisco J | $395,000 | -- | |
| Zabala Felisa C | $274,900 | -- | |
| Masumi Sayed H | $131,500 | -- |
Source: Public Records
Mortgage History
| Date | Status | Borrower | Loan Amount |
|---|---|---|---|
| Open | Argueta Francisco J | $316,000 | |
| Previous Owner | Masumi Sayed H | $261,155 | |
| Previous Owner | Masumi Sayed H | $127,914 |
Source: Public Records
Tax History Compared to Growth
Tax History
| Year | Tax Paid | Tax Assessment Tax Assessment Total Assessment is a certain percentage of the fair market value that is determined by local assessors to be the total taxable value of land and additions on the property. | Land | Improvement |
|---|---|---|---|---|
| 2025 | $5,582 | $542,150 | $170,000 | $372,150 |
| 2024 | $5,582 | $481,850 | $140,000 | $341,850 |
| 2023 | $5,364 | $475,340 | $140,000 | $335,340 |
| 2022 | $5,002 | $437,460 | $130,000 | $307,460 |
| 2021 | $4,558 | $388,410 | $115,000 | $273,410 |
| 2020 | $4,491 | $379,440 | $110,000 | $269,440 |
| 2019 | $4,254 | $359,440 | $100,000 | $259,440 |
| 2018 | $4,078 | $354,640 | $100,000 | $254,640 |
| 2017 | $3,893 | $335,340 | $90,000 | $245,340 |
| 2016 | $3,779 | $326,240 | $85,000 | $241,240 |
| 2015 | $3,641 | $326,240 | $85,000 | $241,240 |
| 2014 | $3,407 | $305,990 | $80,000 | $225,990 |
Source: Public Records
Map
Nearby Homes
- 14079 Red River Dr
- 6311 Betsy Ross Ct
- 6316 Mary Todd Ln
- 14158 Darkwood Cir
- 6309 Trevilian Place
- 14146 Red River Dr
- 14102 Autumn Cir
- 6488 Palisades Dr
- 14005C Grumble Jones Ct
- 14159 Autumn Cir
- 14000 Grumble Jones Ct Unit B
- 6605 English Saddle Ct
- 14002C Walter Bowie Ln
- 13906 Big Yankee Ln
- 13875 Laura Ratcliff Ct
- 13975 Tanners House Way
- 6080 Deer Hill Ct
- 6218 Stonehunt Place
- 14087 Asher View
- 14216 Hartwood Ct
- 14066 Betsy Ross Ln
- 14062 Betsy Ross Ln
- 14068 Betsy Ross Ln
- 14060 Betsy Ross Ln
- 14070 Betsy Ross Ln
- 14072 Betsy Ross Ln
- 14036 Betsy Ross Ln
- 14100 Betsy Ross Ln
- 14034 Betsy Ross Ln
- 14102 Betsy Ross Ln
- 14032 Betsy Ross Ln
- 14065 Betsy Ross Ln
- 14067 Betsy Ross Ln
- 14063 Betsy Ross Ln
- 14071 Betsy Ross Ln
- 14061 Betsy Ross Ln
- 14104 Betsy Ross Ln
- 14030 Betsy Ross Ln
- 14073 Betsy Ross Ln
- 14059 Betsy Ross Ln