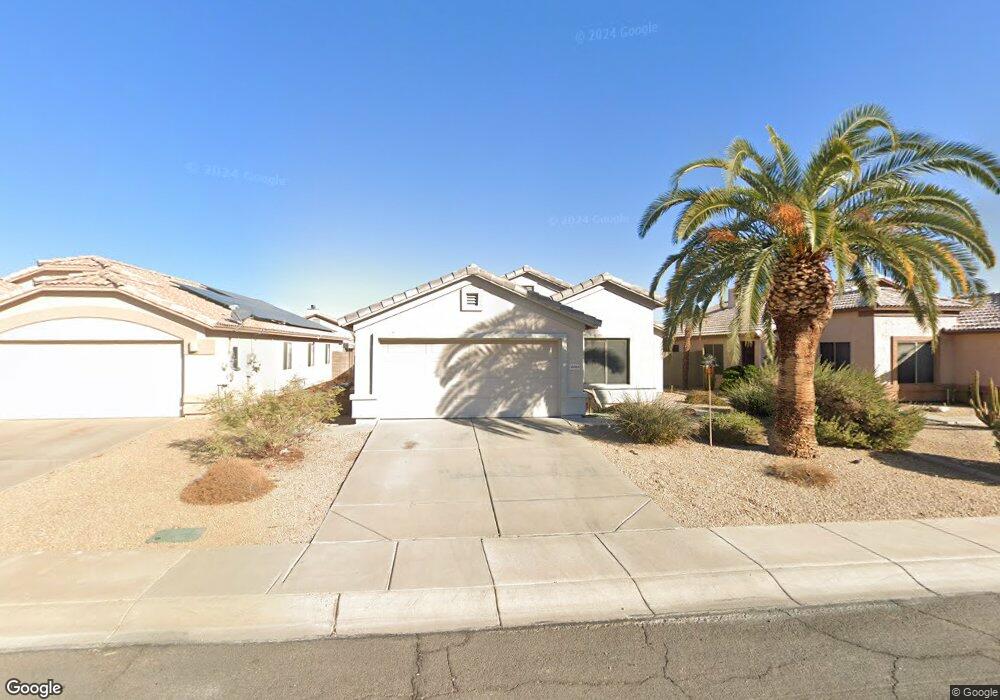
14064 W Fieldings Ferry Surprise, AZ 85374
Estimated Value: $292,098 - $347,000
3
Beds
2
Baths
1,373
Sq Ft
$242/Sq Ft
Est. Value
About This Home
This home is located at 14064 W Fieldings Ferry, Surprise, AZ 85374 and is currently estimated at $332,025, approximately $241 per square foot. 14064 W Fieldings Ferry is a home located in Maricopa County with nearby schools including Kingswood Elementary School, Willow Canyon High School, and Arizona Charter Academy.
Ownership History
Date
Name
Owned For
Owner Type
Purchase Details
Closed on
Aug 9, 2005
Sold by
Bagley Kristina L and Coelho Kristina L
Bought by
Ott Larry Lee and Ott Rachael Ann
Current Estimated Value
Purchase Details
Closed on
Sep 8, 2003
Sold by
Dasse James Patrick and Dasse Gidget Anne
Bought by
Coelho Kristina L
Home Financials for this Owner
Home Financials are based on the most recent Mortgage that was taken out on this home.
Original Mortgage
$122,405
Interest Rate
6.3%
Mortgage Type
FHA
Purchase Details
Closed on
Sep 17, 1999
Sold by
U S Development Inc
Bought by
Dasse James Patrick and Dasse Gidget Anne
Home Financials for this Owner
Home Financials are based on the most recent Mortgage that was taken out on this home.
Original Mortgage
$103,350
Interest Rate
7.89%
Mortgage Type
VA
Create a Home Valuation Report for This Property
The Home Valuation Report is an in-depth analysis detailing your home's value as well as a comparison with similar homes in the area
Home Values in the Area
Average Home Value in this Area
Purchase History
| Date | Buyer | Sale Price | Title Company |
|---|---|---|---|
| Ott Larry Lee | $220,000 | Lawyers Title Ins | |
| Coelho Kristina L | $123,500 | Equity Title Agency Inc | |
| Dasse James Patrick | $101,335 | Transnation Title Ins Co | |
| U S Development Inc | -- | Transnation Title Ins Co |
Source: Public Records
Mortgage History
| Date | Status | Borrower | Loan Amount |
|---|---|---|---|
| Previous Owner | Coelho Kristina L | $122,405 | |
| Previous Owner | Dasse James Patrick | $103,350 |
Source: Public Records
Tax History Compared to Growth
Tax History
| Year | Tax Paid | Tax Assessment Tax Assessment Total Assessment is a certain percentage of the fair market value that is determined by local assessors to be the total taxable value of land and additions on the property. | Land | Improvement |
|---|---|---|---|---|
| 2025 | $1,118 | $11,890 | -- | -- |
| 2024 | $1,177 | $11,324 | -- | -- |
| 2023 | $1,177 | $23,430 | $4,680 | $18,750 |
| 2022 | $1,107 | $18,810 | $3,760 | $15,050 |
| 2021 | $1,144 | $16,930 | $3,380 | $13,550 |
| 2020 | $1,134 | $15,530 | $3,100 | $12,430 |
| 2019 | $1,105 | $13,850 | $2,770 | $11,080 |
| 2018 | $1,084 | $12,480 | $2,490 | $9,990 |
| 2017 | $1,039 | $11,010 | $2,200 | $8,810 |
| 2016 | $989 | $10,330 | $2,060 | $8,270 |
| 2015 | $919 | $9,360 | $1,870 | $7,490 |
Source: Public Records
Map
Nearby Homes
- 14041 W Two Guns Trail
- 14033 W Two Guns Trail
- 17741 N Desert Flower Trail
- 17865 N Desert Flower Trail
- 17718 N Desert Flower Trail
- 14235 W Shawnee Trail
- 14371 W Morning Star Trail
- 13703 W Aleppo Dr Unit 22
- 18019 N 137th Dr
- 13727 W Aleppo Dr
- 14300 W Bell Rd Unit 303
- 14300 W Bell Rd Unit 381
- 14300 W Bell Rd Unit 392
- 14300 W Bell Rd Unit 232
- 14300 W Bell Rd Unit 83
- 14300 W Bell Rd Unit 27
- 14300 W Bell Rd Unit 105
- 14489 W Morning Star Trail
- 17224 N Zuni Trail
- 17543 N Rainbow Cir
- 14064 W Fieldings Ferry
- 14056 W Fieldings Ferry
- 14072 W Fieldings Ferry
- 14072 W Fieldings Ferry
- 14056 W Fieldings Ferry
- 14048 W Fieldings Ferry
- 14048 W Fieldings Ferry
- 14057 W Cornerstone Trail
- 14049 W Cornerstone Trail
- 14080 W Fieldings Ferry
- 14080 W Fieldings Ferry
- 14073 W Cornerstone Trail
- 14043 W Cornerstone Trail
- 14032 W Fieldings Ferry
- 14053 W Fieldings Ferry
- 14053 W Fieldings Ferry
- 14061 W Fieldings Ferry
- 14061 W Fieldings Ferry
- 14069 W Fieldings Ferry
- 14069 W Fieldings Ferry