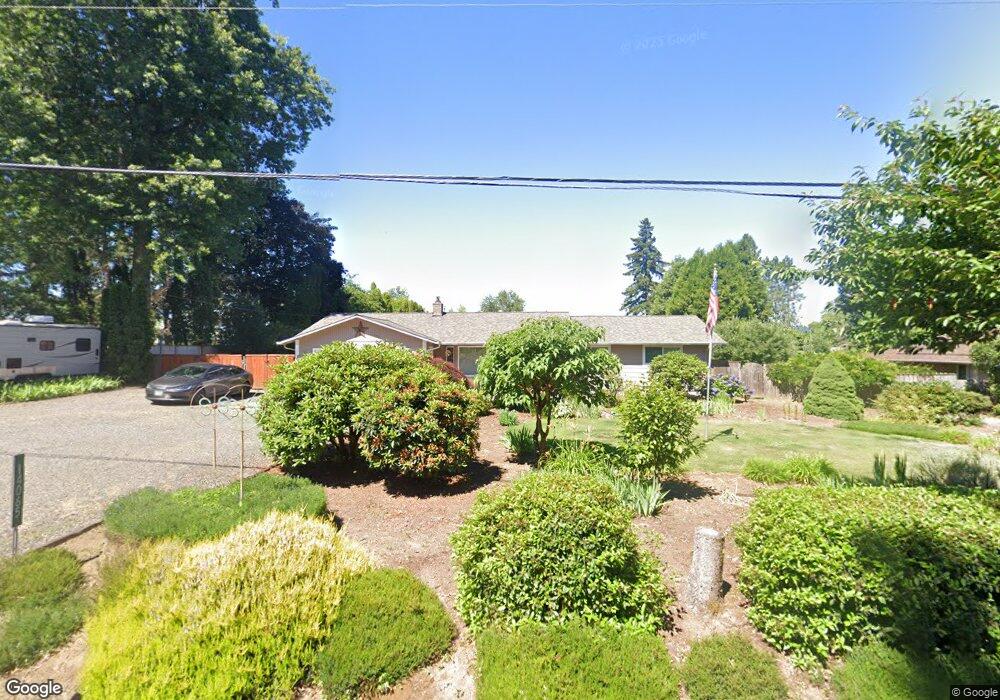
14065 SE 312th Dr Boring, OR 97009
Estimated Value: $589,000 - $624,000
3
Beds
2
Baths
1,550
Sq Ft
$386/Sq Ft
Est. Value
About This Home
This home is located at 14065 SE 312th Dr, Boring, OR 97009 and is currently estimated at $598,854, approximately $386 per square foot. 14065 SE 312th Dr is a home located in Clackamas County with nearby schools including Naas Elementary School, Boring Middle School, and Sandy High School.
Ownership History
Date
Name
Owned For
Owner Type
Purchase Details
Closed on
Jun 27, 2006
Sold by
Mcdaniel Jeffrey J
Bought by
Stricker Sylvia M and Stricker Steve F
Current Estimated Value
Purchase Details
Closed on
Nov 19, 2003
Sold by
Steelman Richard L and Steelman Lauretta J
Bought by
Mcdaniel Jeffrey J
Home Financials for this Owner
Home Financials are based on the most recent Mortgage that was taken out on this home.
Original Mortgage
$202,500
Interest Rate
5.75%
Mortgage Type
Purchase Money Mortgage
Create a Home Valuation Report for This Property
The Home Valuation Report is an in-depth analysis detailing your home's value as well as a comparison with similar homes in the area
Home Values in the Area
Average Home Value in this Area
Purchase History
| Date | Buyer | Sale Price | Title Company |
|---|---|---|---|
| Stricker Sylvia M | $350,000 | Lawyers Title Ins | |
| Mcdaniel Jeffrey J | $225,000 | Chicago Title Insurance Comp |
Source: Public Records
Mortgage History
| Date | Status | Borrower | Loan Amount |
|---|---|---|---|
| Previous Owner | Mcdaniel Jeffrey J | $202,500 |
Source: Public Records
Tax History Compared to Growth
Tax History
| Year | Tax Paid | Tax Assessment Tax Assessment Total Assessment is a certain percentage of the fair market value that is determined by local assessors to be the total taxable value of land and additions on the property. | Land | Improvement |
|---|---|---|---|---|
| 2024 | $4,071 | $275,434 | -- | -- |
| 2023 | $4,071 | $267,412 | $0 | $0 |
| 2022 | $3,723 | $259,624 | $0 | $0 |
| 2021 | $3,591 | $252,063 | $0 | $0 |
| 2020 | $3,503 | $244,722 | $0 | $0 |
| 2019 | $3,503 | $237,595 | $0 | $0 |
| 2018 | $3,359 | $230,675 | $0 | $0 |
| 2017 | $3,270 | $223,956 | $0 | $0 |
| 2016 | $3,123 | $217,433 | $0 | $0 |
| 2015 | $3,033 | $211,100 | $0 | $0 |
| 2014 | $2,969 | $204,951 | $0 | $0 |
Source: Public Records
Map
Nearby Homes
- 13025 SE Orient Dr Unit 26
- 13025 SE Orient Dr Unit 8
- 14700 SE Tickle Creek Rd
- 15550 SE Tickle Creek Rd
- 29590 SE Highway 212
- 28970 SE Church Rd
- 12040 SE Revenue Rd
- 33685 SE Kelso Rd
- 13651 SE Orient Dr
- 11119 SE Linny Ln
- 29990 SE Knox Rd
- 17222 SE Tickle Creek Rd
- 28471 SE Andy St
- 17501 SE Fosberg Rd
- 11007 SE Mccreary Ln
- 29201 SE Hillyard Dr
- 29254 SE Hillyard Dr
- 32900 SE Colorado Rd
- 34603 SE Jarl Rd
- 12275 SE School Ave
- 14025 SE 312th Dr
- 14131 SE 312th Ave
- 14130 SE 312th Dr
- 13989 SE 312th Dr
- 14171 SE 312th Dr
- 14054 SE 312th Dr
- 31265 SE Hamlet Dr
- 14020 SE 312th Dr
- 14217 SE 312th Dr
- 13951 SE 312th Dr
- 31256 SE Hamlet Dr
- 31331 SE Hamlet Dr
- 13857 SE 312th Dr
- 14303 SE 312th Dr
- 31300 SE Hamlet Dr
- 14330 SE 312th Dr
- 13839 SE 312th Dr
- 14363 SE 312th Dr
- 13845 SE 312th Dr
- 31400 SE Hamlet Dr