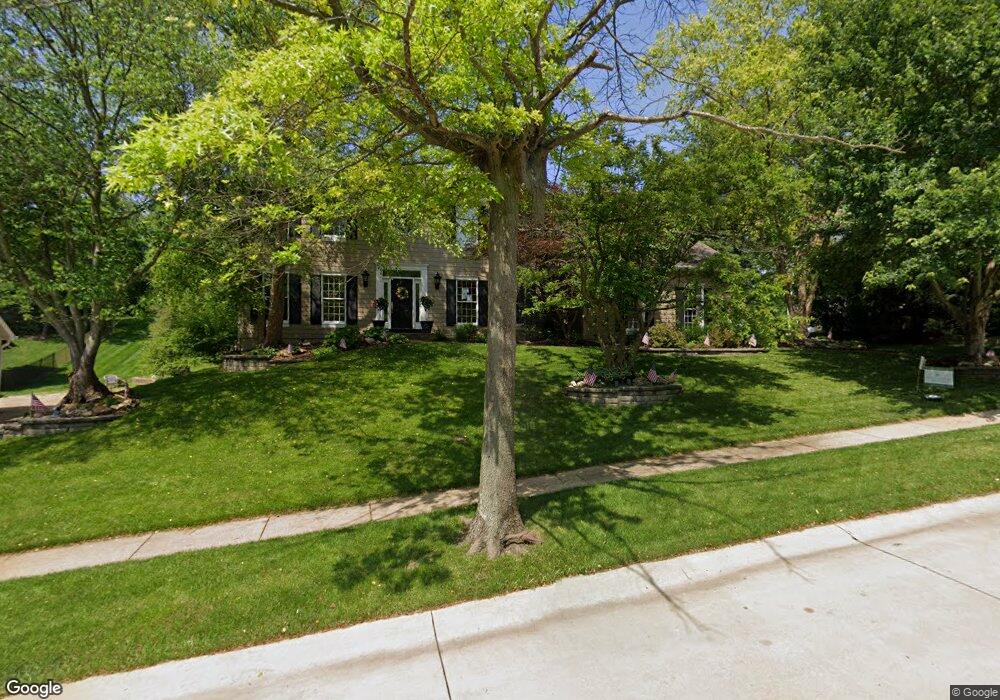
1407 Carriage Crossing Ln Chesterfield, MO 63005
Estimated Value: $867,000 - $1,140,000
4
Beds
4
Baths
3,492
Sq Ft
$282/Sq Ft
Est. Value
About This Home
This home is located at 1407 Carriage Crossing Ln, Chesterfield, MO 63005 and is currently estimated at $983,890, approximately $281 per square foot. 1407 Carriage Crossing Ln is a home located in St. Louis County with nearby schools including Wild Horse Elementary, Crestview Middle School, and Marquette Sr. High School.
Ownership History
Date
Name
Owned For
Owner Type
Purchase Details
Closed on
Jul 24, 2000
Sold by
Berberich William J
Bought by
Berberich William J and Berberich Susan L
Current Estimated Value
Purchase Details
Closed on
Jun 10, 1999
Sold by
Heshmati Mohammad and Heshmati Andrea L
Bought by
Berberich William J
Home Financials for this Owner
Home Financials are based on the most recent Mortgage that was taken out on this home.
Original Mortgage
$308,800
Outstanding Balance
$81,239
Interest Rate
7.02%
Estimated Equity
$902,651
Purchase Details
Closed on
Apr 17, 1998
Sold by
Champion Lynwood A and Ann Lea
Bought by
Heshmati Mohammad and Heshmati Andrea L
Home Financials for this Owner
Home Financials are based on the most recent Mortgage that was taken out on this home.
Original Mortgage
$287,000
Interest Rate
7.21%
Create a Home Valuation Report for This Property
The Home Valuation Report is an in-depth analysis detailing your home's value as well as a comparison with similar homes in the area
Home Values in the Area
Average Home Value in this Area
Purchase History
| Date | Buyer | Sale Price | Title Company |
|---|---|---|---|
| Berberich William J | -- | -- | |
| Berberich William J | $386,000 | -- | |
| Heshmati Mohammad | -- | First American Title |
Source: Public Records
Mortgage History
| Date | Status | Borrower | Loan Amount |
|---|---|---|---|
| Open | Berberich William J | $308,800 | |
| Previous Owner | Heshmati Mohammad | $287,000 |
Source: Public Records
Tax History Compared to Growth
Tax History
| Year | Tax Paid | Tax Assessment Tax Assessment Total Assessment is a certain percentage of the fair market value that is determined by local assessors to be the total taxable value of land and additions on the property. | Land | Improvement |
|---|---|---|---|---|
| 2025 | $11,303 | $190,040 | $48,320 | $141,720 |
| 2024 | $11,303 | $158,880 | $24,170 | $134,710 |
| 2023 | $11,010 | $158,880 | $24,170 | $134,710 |
| 2022 | $10,058 | $134,940 | $26,580 | $108,360 |
| 2021 | $10,000 | $134,940 | $26,580 | $108,360 |
| 2020 | $8,649 | $123,000 | $20,650 | $102,350 |
| 2019 | $7,434 | $97,300 | $20,650 | $76,650 |
| 2018 | $7,335 | $90,530 | $20,650 | $69,880 |
| 2017 | $7,170 | $90,530 | $20,650 | $69,880 |
| 2016 | $7,357 | $89,260 | $20,650 | $68,610 |
| 2015 | $7,203 | $89,260 | $20,650 | $68,610 |
| 2014 | $7,091 | $85,550 | $17,990 | $67,560 |
Source: Public Records
Map
Nearby Homes
- 1419 Carriage Crossing Ln
- 1504 Kehrs Mill Rd
- 1577 Kehrs Mill Rd
- 17106 Chaise Ridge Rd
- 1315 Wildhorse Meadows Dr
- 16499 Horseshoe Ridge Rd
- 1482 Country Lake Estates Dr
- 17283 Courtyard Mill Ln
- 1475 Country Lake Estates Dr
- 17421 Private Valley Ln
- 6 Kehrs Mill Glen Ct
- 16908 Lewis Spring Farms Rd
- 16446 Dapple Gray Ct
- 17609 Burnham Ct
- 1230 Wildhorse Parkway Dr
- 17702 Horse Creek Ct
- 17411 Wild Horse Creek Rd
- 17643 Wildridge Dr
- 375 Griffith Ln
- 1205 Patchwork Fields
- 1403 Carriage Crossing Ln
- 1369 Carriage Crossing Ln
- 1528 Kehrs Mill (Not On Main Rd)
- 1404 Carriage Crossing Ln
- 1528 Kehrs Mill Rd
- 1415 Carriage Crossing Ln
- 17173 Surrey View Dr
- 17172 Surrey View Dr
- 1550 Kehrs Mill Rd
- 1420 Carriage Crossing Ln
- 1364 Carriage Crossing Ln
- 17166 Surrey View Dr
- 1423 Carriage Crossing Ln
- 17167 Surrey View Dr
- 1428 Carriage Crossing Ln
- 1580 Kehrs Mill Rd
- 1360 Carriage Crossing Ln
- 17160 Surrey View Dr
- 1432 Carriage Crossing Ln
- 17163 Surrey View Dr