Estimated Value: $178,000 - $198,000
3
Beds
2
Baths
1,100
Sq Ft
$169/Sq Ft
Est. Value
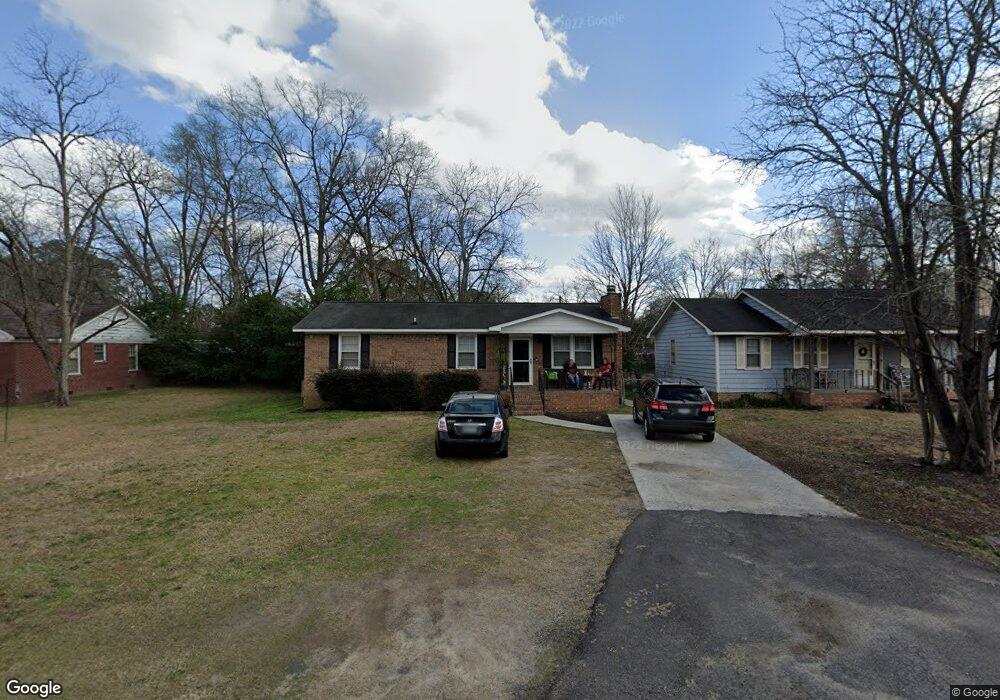
About This Home
This home is located at 1407 Hemlock St, Cayce, SC 29033 and is currently estimated at $185,819, approximately $168 per square foot. 1407 Hemlock St is a home located in Lexington County with nearby schools including Cayce Elementary, Cyril B. Busbee Creative Arts Academy, and Brookland-Cayce High School.
Ownership History
Date
Name
Owned For
Owner Type
Purchase Details
Closed on
Apr 13, 2018
Sold by
Neely Jesse C
Bought by
Crane Alfred and Crane Kayla G
Current Estimated Value
Home Financials for this Owner
Home Financials are based on the most recent Mortgage that was taken out on this home.
Original Mortgage
$97,206
Outstanding Balance
$85,546
Interest Rate
5.5%
Mortgage Type
FHA
Estimated Equity
$100,273
Purchase Details
Closed on
Feb 28, 2008
Sold by
Key Vanessa P and Key Eugene E
Bought by
Neely Jesse C
Home Financials for this Owner
Home Financials are based on the most recent Mortgage that was taken out on this home.
Original Mortgage
$4,000
Interest Rate
5.63%
Mortgage Type
Negative Amortization
Purchase Details
Closed on
May 11, 2007
Sold by
Hud
Bought by
Key Vanessa P and Key Eugene E
Purchase Details
Closed on
Nov 30, 2006
Sold by
Sanders Lisa A
Bought by
Hud
Purchase Details
Closed on
Dec 13, 2004
Sold by
Jefferson L W and Jefferson Francis
Bought by
Sanders Lisa A
Create a Home Valuation Report for This Property
The Home Valuation Report is an in-depth analysis detailing your home's value as well as a comparison with similar homes in the area
Home Values in the Area
Average Home Value in this Area
Purchase History
| Date | Buyer | Sale Price | Title Company |
|---|---|---|---|
| Crane Alfred | $99,000 | None Available | |
| Neely Jesse C | $94,000 | None Available | |
| Key Vanessa P | $70,700 | None Available | |
| Hud | $90,760 | None Available | |
| Sanders Lisa A | $82,000 | -- |
Source: Public Records
Mortgage History
| Date | Status | Borrower | Loan Amount |
|---|---|---|---|
| Open | Crane Alfred | $97,206 | |
| Previous Owner | Neely Jesse C | $4,000 | |
| Previous Owner | Neely Jesse C | $91,100 |
Source: Public Records
Tax History Compared to Growth
Tax History
| Year | Tax Paid | Tax Assessment Tax Assessment Total Assessment is a certain percentage of the fair market value that is determined by local assessors to be the total taxable value of land and additions on the property. | Land | Improvement |
|---|---|---|---|---|
| 2024 | $727 | $3,641 | $560 | $3,081 |
| 2023 | $657 | $3,641 | $560 | $3,081 |
| 2022 | $649 | $3,641 | $560 | $3,081 |
| 2020 | $632 | $3,641 | $560 | $3,081 |
| 2019 | $702 | $3,960 | $560 | $3,400 |
| 2018 | $574 | $3,265 | $560 | $2,705 |
| 2017 | $553 | $3,265 | $560 | $2,705 |
| 2016 | $563 | $3,264 | $560 | $2,704 |
| 2014 | $476 | $3,792 | $800 | $2,992 |
| 2013 | -- | $3,790 | $800 | $2,990 |
Source: Public Records
Map
Nearby Homes
- 1409 Hemlock St
- 1405 Hemlock St
- 1411 Hemlock St
- 1414 Lexington St
- 1410 Lexington St
- 2348 Vine St
- 1418 Lexington St
- 1415 Hemlock St
- 1422 Lexington St
- 2356 Vine St
- 2370 Orchard St
- 1308 Hemlock St
- 2366 Orchard St
- 1418 Northland Dr
- 1414 Northland Dr
- 2362 Orchard St
- 2351 Vine St
- 1422 Northland Dr
- 1412 Northland Dr
- 2358 Orchard St