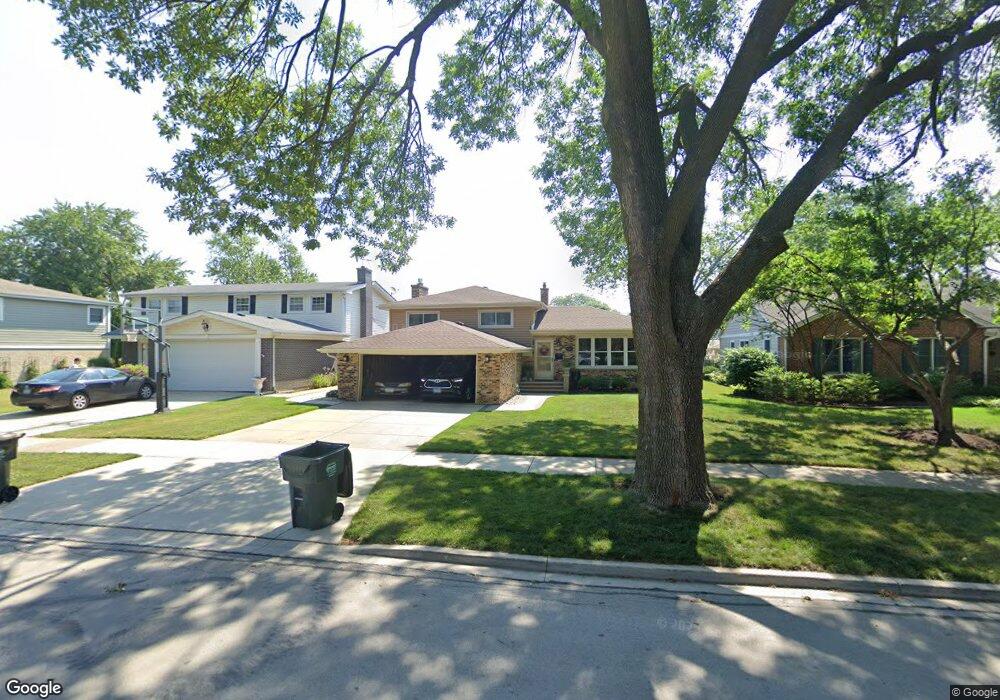
1407 N Walnut Ave Arlington Heights, IL 60004
Estimated Value: $516,008 - $567,000
4
Beds
3
Baths
1,800
Sq Ft
$301/Sq Ft
Est. Value
About This Home
This home is located at 1407 N Walnut Ave, Arlington Heights, IL 60004 and is currently estimated at $541,002, approximately $300 per square foot. 1407 N Walnut Ave is a home located in Cook County with nearby schools including Olive-Mary Stitt Elementary School, Thomas Middle School, and John Hersey High School.
Ownership History
Date
Name
Owned For
Owner Type
Purchase Details
Closed on
Feb 27, 2015
Sold by
Knoll Kenneth H and Boe Knoll Laura E
Bought by
Knoll Kenneth H and Boe Knoll Laura E
Current Estimated Value
Home Financials for this Owner
Home Financials are based on the most recent Mortgage that was taken out on this home.
Original Mortgage
$258,635
Outstanding Balance
$90,117
Interest Rate
3%
Mortgage Type
New Conventional
Estimated Equity
$450,885
Purchase Details
Closed on
Jun 6, 2012
Sold by
Knoll Kenneth H and Knoll Laure E
Bought by
Knoll Kenneth H and Boe Knoll Laura E
Purchase Details
Closed on
Mar 4, 2011
Sold by
Paige Mary Elizabeth
Bought by
Knoll Kenneth H and Knoll Laura E
Home Financials for this Owner
Home Financials are based on the most recent Mortgage that was taken out on this home.
Original Mortgage
$282,550
Interest Rate
4.5%
Mortgage Type
FHA
Purchase Details
Closed on
Aug 17, 1995
Sold by
Paige Orion B and Paige Mathilda H
Bought by
Paige Orion B and Paige Mathilda H
Create a Home Valuation Report for This Property
The Home Valuation Report is an in-depth analysis detailing your home's value as well as a comparison with similar homes in the area
Home Values in the Area
Average Home Value in this Area
Purchase History
| Date | Buyer | Sale Price | Title Company |
|---|---|---|---|
| Knoll Kenneth H | -- | Linear Title & Closing | |
| Knoll Kenneth H | -- | None Available | |
| Knoll Kenneth H | $290,000 | None Available | |
| Paige Orion B | -- | -- |
Source: Public Records
Mortgage History
| Date | Status | Borrower | Loan Amount |
|---|---|---|---|
| Open | Knoll Kenneth H | $258,635 | |
| Closed | Knoll Kenneth H | $282,550 |
Source: Public Records
Tax History Compared to Growth
Tax History
| Year | Tax Paid | Tax Assessment Tax Assessment Total Assessment is a certain percentage of the fair market value that is determined by local assessors to be the total taxable value of land and additions on the property. | Land | Improvement |
|---|---|---|---|---|
| 2024 | $9,221 | $37,000 | $7,920 | $29,080 |
| 2023 | $8,854 | $37,000 | $7,920 | $29,080 |
| 2022 | $8,854 | $37,000 | $7,920 | $29,080 |
| 2021 | $8,308 | $30,928 | $4,950 | $25,978 |
| 2020 | $8,159 | $30,928 | $4,950 | $25,978 |
| 2019 | $8,122 | $34,365 | $4,950 | $29,415 |
| 2018 | $8,372 | $32,126 | $4,356 | $27,770 |
| 2017 | $8,291 | $32,126 | $4,356 | $27,770 |
| 2016 | $7,969 | $32,126 | $4,356 | $27,770 |
| 2015 | $7,528 | $28,120 | $3,762 | $24,358 |
| 2014 | $7,324 | $28,120 | $3,762 | $24,358 |
| 2013 | $7,123 | $28,120 | $3,762 | $24,358 |
Source: Public Records
Map
Nearby Homes
- 1317 N Mitchell Ave
- 1237 N Ridge Ave
- 1142 N Mitchell Ave
- 1136 N Walnut Ave
- 1729 N Mitchell Ave
- 1123 N Dunton Ave
- 1518 N Patton Ave
- 924 N Highland Ave
- 910 N Chestnut Ave
- 1001 N Dunton Ave
- 1416 W Lynnwood Ave
- 1105 N Harvard Ave
- 1839 N Fernandez Ave
- 1825 N Kaspar Ave
- 1418 W Maude Ave
- 827 N Walnut Ave
- 25 E Palatine Rd Unit 303
- 25 E Palatine Rd Unit 207
- 1653 N Belmont Ct Unit 31
- 1605 N Chicago Ave
- 1411 N Walnut Ave
- 1403 N Walnut Ave
- 1415 N Walnut Ave
- 1406 N Mitchell Ave
- 1410 N Mitchell Ave
- 1339 N Walnut Ave
- 1414 N Mitchell Ave
- 1419 N Walnut Ave
- 1402 N Mitchell Ave
- 1408 N Walnut Ave
- 1404 N Walnut Ave
- 1412 N Walnut Ave
- 1418 N Mitchell Ave
- 1402 N Walnut Ave
- 1423 N Walnut Ave
- 1416 N Walnut Ave
- 1336 N Mitchell Ave
- 1331 N Walnut Ave
- 1338 N Walnut Ave
- 1428 N Mitchell Ave