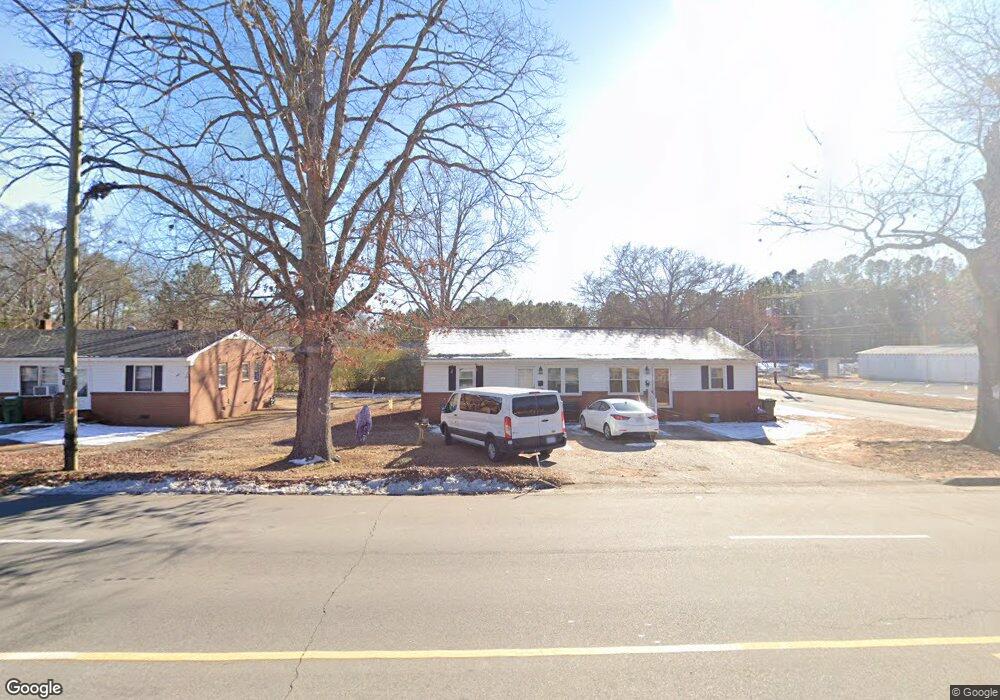
1407 W 10th St Unit 1409 Roanoke Rapids, NC 27870
Estimated Value: $127,000 - $149,563
4
Beds
2
Baths
1,782
Sq Ft
$76/Sq Ft
Est. Value
About This Home
This home is located at 1407 W 10th St Unit 1409, Roanoke Rapids, NC 27870 and is currently estimated at $134,891, approximately $75 per square foot. 1407 W 10th St Unit 1409 is a home located in Halifax County with nearby schools including Roanoke Rapids High School and Victory Christian Academy.
Ownership History
Date
Name
Owned For
Owner Type
Purchase Details
Closed on
Apr 8, 2019
Sold by
Davis Ruby V
Bought by
Nelson Connie D
Current Estimated Value
Purchase Details
Closed on
Aug 18, 2010
Sold by
Us Bank Na
Bought by
Davis Ruby V
Purchase Details
Closed on
Nov 17, 2009
Sold by
Davis Michael T and Davis Debra W
Bought by
Us Bank Na
Purchase Details
Closed on
May 26, 2005
Sold by
Mtd Investments Inc
Bought by
Davis Michael T and Davis Debra W
Create a Home Valuation Report for This Property
The Home Valuation Report is an in-depth analysis detailing your home's value as well as a comparison with similar homes in the area
Home Values in the Area
Average Home Value in this Area
Purchase History
| Date | Buyer | Sale Price | Title Company |
|---|---|---|---|
| Nelson Connie D | -- | -- | |
| Davis Ruby V | $46,000 | -- | |
| Us Bank Na | $77,500 | -- | |
| Davis Michael T | -- | None Available | |
| Davis Michael T | -- | None Available |
Source: Public Records
Tax History Compared to Growth
Tax History
| Year | Tax Paid | Tax Assessment Tax Assessment Total Assessment is a certain percentage of the fair market value that is determined by local assessors to be the total taxable value of land and additions on the property. | Land | Improvement |
|---|---|---|---|---|
| 2025 | $22 | $101,500 | $17,400 | $84,100 |
| 2024 | $22 | $101,500 | $17,400 | $84,100 |
| 2023 | $2,078 | $88,400 | $17,400 | $71,000 |
| 2022 | $2,072 | $88,400 | $17,400 | $71,000 |
| 2021 | $1,979 | $88,400 | $17,400 | $71,000 |
| 2020 | $1,962 | $88,400 | $17,400 | $71,000 |
| 2019 | $1,893 | $83,100 | $17,400 | $65,700 |
| 2018 | $1,885 | $83,100 | $17,400 | $65,700 |
| 2017 | $1,829 | $83,100 | $17,400 | $65,700 |
| 2016 | $1,904 | $83,100 | $17,400 | $65,700 |
| 2015 | $1,822 | $83,100 | $17,400 | $65,700 |
| 2014 | $1,754 | $83,340 | $18,850 | $64,490 |
Source: Public Records
Map
Nearby Homes