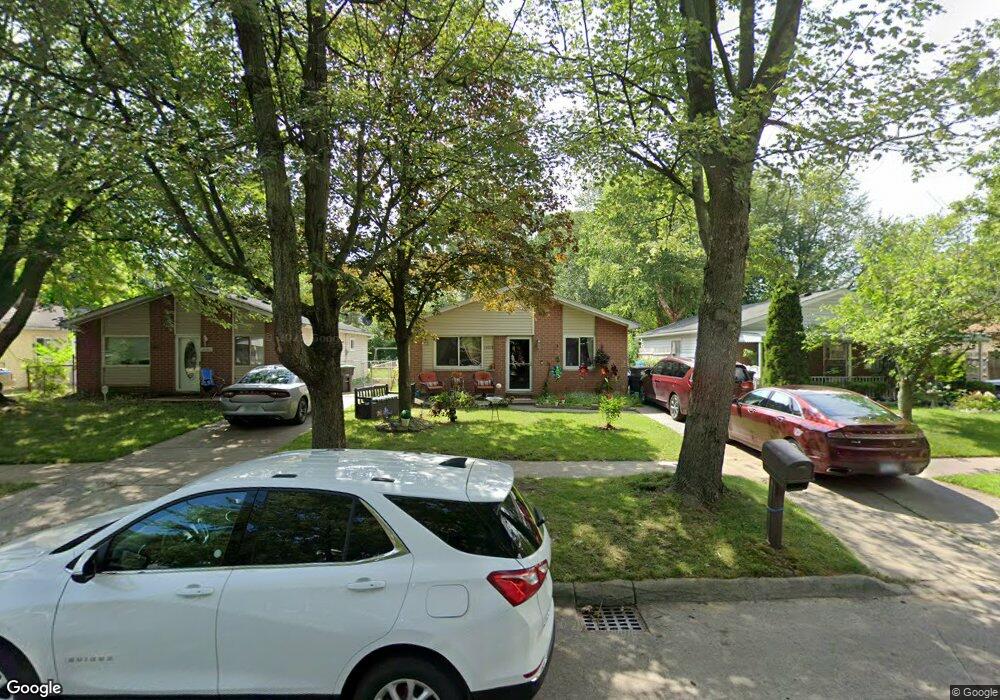
14072 Marvin St Taylor, MI 48180
Estimated Value: $154,000 - $165,000
3
Beds
1
Bath
949
Sq Ft
$167/Sq Ft
Est. Value
About This Home
This home is located at 14072 Marvin St, Taylor, MI 48180 and is currently estimated at $158,268, approximately $166 per square foot. 14072 Marvin St is a home located in Wayne County with nearby schools including Eureka Heights Elementary School, Hoover Middle School, and Taylor High School.
Ownership History
Date
Name
Owned For
Owner Type
Purchase Details
Closed on
Apr 3, 2024
Sold by
Sfr3-050 Llc
Bought by
Sfr3-080 Llc
Current Estimated Value
Purchase Details
Closed on
Dec 28, 2021
Sold by
Opalinski Brian
Bought by
Sfr3-050 Llc
Purchase Details
Closed on
Sep 16, 2009
Sold by
Scroggin Darrell and Scroggin Corrin
Bought by
Federal National Mortgage Association
Purchase Details
Closed on
Jun 1, 2009
Sold by
Citimortgage Inc
Bought by
Federal National Mortgage Association
Purchase Details
Closed on
May 21, 2009
Sold by
Scroggin Darrell and Scroggin Corrin
Bought by
Citimortgage Inc
Purchase Details
Closed on
Oct 26, 2007
Sold by
Bunch Norman and Bunch Susan
Bought by
Scroggin Darrell
Purchase Details
Closed on
May 3, 2006
Sold by
Mcmaster Wendi and Kristobans John K
Bought by
Wells Fargo Bank Na and Option One Mortgage Loan Trust 2001-D As
Purchase Details
Closed on
Nov 29, 2001
Sold by
Kristobans John
Bought by
Mcmaster Wendi
Create a Home Valuation Report for This Property
The Home Valuation Report is an in-depth analysis detailing your home's value as well as a comparison with similar homes in the area
Home Values in the Area
Average Home Value in this Area
Purchase History
| Date | Buyer | Sale Price | Title Company |
|---|---|---|---|
| Sfr3-080 Llc | -- | None Listed On Document | |
| Sfr3-050 Llc | $42,000 | None Listed On Document | |
| Sfr3-050 Llc | $42,000 | None Listed On Document | |
| Federal National Mortgage Association | $1,000 | None Available | |
| Federal National Mortgage Association | -- | None Available | |
| Citimortgage Inc | $117,895 | None Available | |
| Scroggin Darrell | $110,000 | Lawyers Title | |
| Wells Fargo Bank Na | $71,820 | None Available | |
| Mcmaster Wendi | $87,000 | -- | |
| Kristobans John | -- | -- |
Source: Public Records
Tax History
| Year | Tax Paid | Tax Assessment Tax Assessment Total Assessment is a certain percentage of the fair market value that is determined by local assessors to be the total taxable value of land and additions on the property. | Land | Improvement |
|---|---|---|---|---|
| 2025 | $3,127 | $64,600 | $0 | $0 |
| 2024 | $2,900 | $59,600 | $0 | $0 |
| 2023 | $3,048 | $51,200 | $0 | $0 |
| 2022 | $2,728 | $42,900 | $0 | $0 |
| 2021 | $1,368 | $37,500 | $0 | $0 |
| 2020 | $1,575 | $37,300 | $0 | $0 |
| 2019 | $196,615 | $31,800 | $0 | $0 |
| 2018 | $974 | $23,800 | $0 | $0 |
| 2017 | $1,375 | $23,500 | $0 | $0 |
| 2016 | $1,605 | $22,800 | $0 | $0 |
| 2015 | $2,200 | $22,000 | $0 | $0 |
| 2013 | $2,550 | $26,500 | $0 | $0 |
| 2012 | $1,137 | $25,800 | $8,300 | $17,500 |
Source: Public Records
Map
Nearby Homes
- 26118 Superior Rd
- 13717 Fellrath St
- 13753 Mcguire St
- 13529 Fellrath St
- 14711 Fellrath St
- 15310 Beech Daly Rd
- 00000 Northline Rd
- 15371 Gulley St
- 15390 Gulley St
- 15684 Mcguire St
- 20820 Inkster Rd
- 15143 Siebert St
- 15680 Gulley St
- 15409 Westlake St
- 14611 New York St
- 15532 Wellington St
- 19958 Telegraph Rd
- 16006 Terrace Village Dr Unit 12
- 16609 Terrace Village Dr Unit 117
- 16253 Terrace Village Dr Unit 42
- 14080 Marvin St
- 14064 Marvin St
- 14088 Marvin St
- 14056 Marvin St
- 14048 Marvin St
- 14096 Marvin St
- 14077 Fellrath St
- 14065 Fellrath St
- 14089 Fellrath St
- 14097 Fellrath St
- 14204 Marvin St
- 14040 Marvin St
- 14075 Marvin St
- 14057 Fellrath St
- 14073 Marvin St
- 14081 Marvin St
- 14065 Marvin St
- 14212 Marvin St
- 14089 Marvin St
- 14205 Fellrath St
Your Personal Tour Guide
Ask me questions while you tour the home.