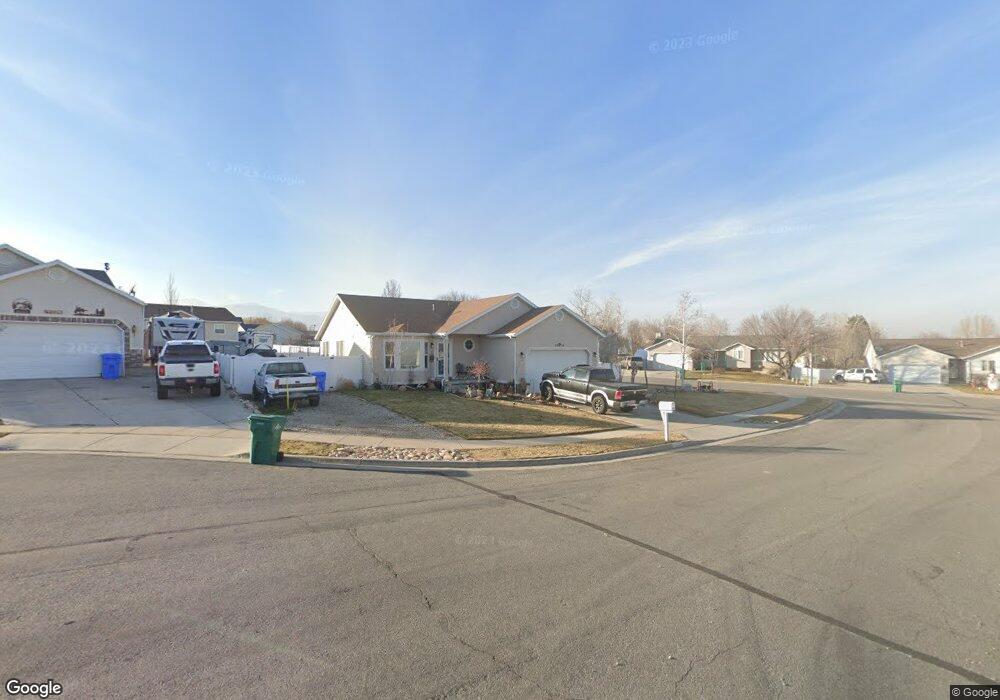
14074 S Grand View Peak Cir Riverton, UT 84096
Estimated Value: $548,000 - $580,421
3
Beds
2
Baths
2,302
Sq Ft
$246/Sq Ft
Est. Value
About This Home
This home is located at 14074 S Grand View Peak Cir, Riverton, UT 84096 and is currently estimated at $565,605, approximately $245 per square foot. 14074 S Grand View Peak Cir is a home located in Salt Lake County with nearby schools including Foothills School, South Hills Middle School, and Mountain Ridge High School.
Ownership History
Date
Name
Owned For
Owner Type
Purchase Details
Closed on
Mar 31, 2020
Sold by
Betts Robyn S and Betts Kenneth C
Bought by
Dazley Wayne Carl and Dazley Kellie Colleen
Current Estimated Value
Home Financials for this Owner
Home Financials are based on the most recent Mortgage that was taken out on this home.
Original Mortgage
$282,375
Outstanding Balance
$250,150
Interest Rate
3.4%
Mortgage Type
New Conventional
Estimated Equity
$315,455
Purchase Details
Closed on
Dec 12, 2018
Sold by
Betts Ken C and Betts Robyn S
Bought by
Betts Robyn S and Betts Kenneth C
Purchase Details
Closed on
Jul 16, 1997
Sold by
Burgon John H
Bought by
Development Associates Inc
Purchase Details
Closed on
Jul 14, 1997
Sold by
Burgon Stanley W
Bought by
Development Associates Inc
Create a Home Valuation Report for This Property
The Home Valuation Report is an in-depth analysis detailing your home's value as well as a comparison with similar homes in the area
Home Values in the Area
Average Home Value in this Area
Purchase History
| Date | Buyer | Sale Price | Title Company |
|---|---|---|---|
| Dazley Wayne Carl | -- | Old Republic Ttl Draper Orem | |
| Betts Robyn S | -- | None Available | |
| Development Associates Inc | -- | -- | |
| Development Associates Inc | -- | -- |
Source: Public Records
Mortgage History
| Date | Status | Borrower | Loan Amount |
|---|---|---|---|
| Open | Dazley Wayne Carl | $282,375 |
Source: Public Records
Tax History Compared to Growth
Tax History
| Year | Tax Paid | Tax Assessment Tax Assessment Total Assessment is a certain percentage of the fair market value that is determined by local assessors to be the total taxable value of land and additions on the property. | Land | Improvement |
|---|---|---|---|---|
| 2025 | $3,081 | $533,600 | $210,700 | $322,900 |
| 2024 | $3,081 | $485,800 | $193,600 | $292,200 |
| 2023 | $3,326 | $486,000 | $179,200 | $306,800 |
| 2022 | $3,195 | $490,000 | $175,700 | $314,300 |
| 2021 | $2,549 | $363,300 | $135,500 | $227,800 |
| 2020 | $2,612 | $347,000 | $105,400 | $241,600 |
| 2019 | $2,526 | $329,900 | $100,400 | $229,500 |
| 2018 | $2,412 | $310,200 | $92,800 | $217,400 |
| 2017 | $2,300 | $288,300 | $92,800 | $195,500 |
| 2016 | $2,213 | $266,200 | $92,800 | $173,400 |
| 2015 | $2,055 | $239,600 | $92,800 | $146,800 |
| 2014 | $1,979 | $226,200 | $88,500 | $137,700 |
Source: Public Records
Map
Nearby Homes
- 4999 W Cave Peak Dr
- 14048 van Cott Peak Cir
- 4827 Boulder Meadow Dr
- 14054 Elk Horn Peak Dr
- 13863 S Kessler Peak Dr
- 14254 S Amber Rose Ln
- 14347 S Mount Ogden Peak Dr
- 13908 S 5180 W
- 4567 W Watchmen Way Unit 1334
- 4722 W Cillian Ln Unit 2411
- 4714 W Cillian Ln Unit 2410
- 4541 W Watchmen Way
- 4698 W Cillian Ln Unit 2409
- 4688 W Cillian Ln Unit 2408
- 4966 W Rose Quartz
- 5279 Leila Ln
- 4682 W Cillian Ln Unit 2407
- 4541 W Ruple Ridge Ln
- 4676 W Cillian Ln Unit 2406
- 14479 Entrada Rim Ln
- 14074 Grand View Peak Cir
- 14088 Grand View Peak Cir
- 14086 Grand View Peak Cir
- 14087 Ben Lomond Peak Dr
- 14087 S Ben Lomond Peak Dr
- 14077 Grand View Peak Cir
- 14077 S Grand View Peak Cir
- 4946 W Grand View Peak Dr
- 14094 Grand View Peak Cir
- 4946 Grand View Peak Dr
- 14094 S Grand View Peak Cir
- 4934 Grand View Peak Dr
- 4956 W Grand View Peak Dr
- 4907 Grand View Peak Dr
- 4907 W Grand View Peak Dr
- 14097 S Ben Lomond Peak Dr
- 14097 Ben Lomond Peak Dr
- 14087 Grand View Peak Cir
- 4922 Grand View Peak Dr
- 14087 S Grand View Peak Cir