Estimated Value: $267,000 - $279,940
3
Beds
2
Baths
1,599
Sq Ft
$171/Sq Ft
Est. Value
About This Home
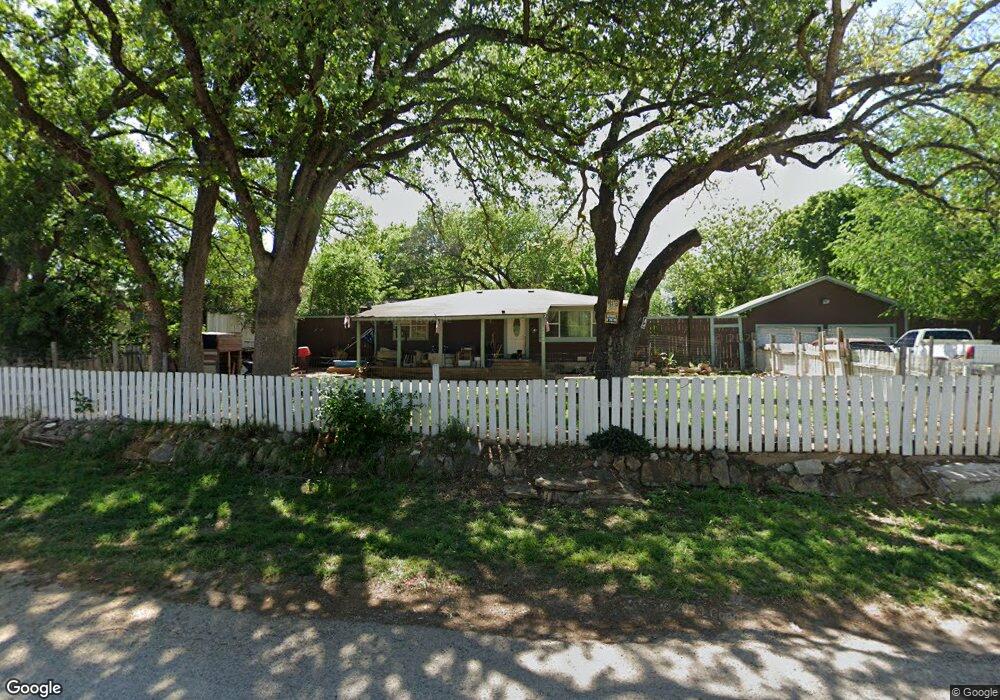
This home is located at 14075 Rucker St, Azle, TX 76020 and is currently estimated at $273,470, approximately $171 per square foot. 14075 Rucker St is a home located in Tarrant County with nearby schools including Liberty Elementary School, W E Hoover Elementary School, and Santo Forte Junior High School.
Ownership History
Date
Name
Owned For
Owner Type
Purchase Details
Closed on
Sep 7, 2001
Sold by
Cato Michael Wayne
Bought by
Foukes Glen R
Current Estimated Value
Home Financials for this Owner
Home Financials are based on the most recent Mortgage that was taken out on this home.
Original Mortgage
$66,300
Outstanding Balance
$25,357
Interest Rate
6.88%
Mortgage Type
Seller Take Back
Estimated Equity
$248,113
Purchase Details
Closed on
Mar 5, 2001
Sold by
Bankers Trust Company Of California Na
Bought by
Cato Michael Wayne and Texas Best Painting & Remodeling
Home Financials for this Owner
Home Financials are based on the most recent Mortgage that was taken out on this home.
Original Mortgage
$44,978
Interest Rate
6.98%
Purchase Details
Closed on
Sep 5, 2000
Sold by
Reeves Henry F and Reeves Robyn Lou
Bought by
Bankers Trust Company Of California Na
Create a Home Valuation Report for This Property
The Home Valuation Report is an in-depth analysis detailing your home's value as well as a comparison with similar homes in the area
Home Values in the Area
Average Home Value in this Area
Purchase History
| Date | Buyer | Sale Price | Title Company |
|---|---|---|---|
| Foukes Glen R | -- | Fidelity National Title | |
| Cato Michael Wayne | -- | Fidelity National Title | |
| Bankers Trust Company Of California Na | $37,800 | -- |
Source: Public Records
Mortgage History
| Date | Status | Borrower | Loan Amount |
|---|---|---|---|
| Open | Foukes Glen R | $66,300 | |
| Previous Owner | Cato Michael Wayne | $44,978 | |
| Closed | Foukes Glen R | $3,900 |
Source: Public Records
Tax History Compared to Growth
Tax History
| Year | Tax Paid | Tax Assessment Tax Assessment Total Assessment is a certain percentage of the fair market value that is determined by local assessors to be the total taxable value of land and additions on the property. | Land | Improvement |
|---|---|---|---|---|
| 2025 | $572 | $200,080 | $51,300 | $148,780 |
| 2024 | $572 | $200,080 | $51,300 | $148,780 |
| 2023 | $1,642 | $212,475 | $51,300 | $161,175 |
| 2022 | $1,740 | $199,536 | $23,940 | $175,596 |
| 2021 | $1,624 | $117,196 | $5,000 | $112,196 |
| 2020 | $1,477 | $109,199 | $5,000 | $104,199 |
| 2019 | $1,397 | $105,643 | $5,000 | $100,643 |
| 2018 | $937 | $62,690 | $5,000 | $57,690 |
| 2017 | $1,099 | $61,962 | $5,000 | $56,962 |
| 2016 | $999 | $62,476 | $5,000 | $57,476 |
| 2015 | $735 | $47,100 | $5,000 | $42,100 |
| 2014 | $735 | $47,100 | $5,000 | $42,100 |
Source: Public Records
Map
Nearby Homes
- 14070 Rucker St
- 7118 Rucker St
- 7071 Darling St
- 7219 Rucker St
- 7218 Alcove St
- 7047 Alcove St
- 6827 Briar Rd
- 6811 Briar Rd
- 6870 Briar Rd
- #7 Tbd Briar Rd
- 14095 Liberty School Rd
- 13730 Williams Rd
- 13690 Liberty School Rd
- 7401 Briar Rd
- 1662 Rogers Rd
- 7350 Briar Rd
- 6955 Allyn Dr
- 00000 Eagle Pointe
- 0000 Eagle Pointe
- 7450 Briar Rd
- 6968 Camp St
- 14064 Rucker St
- 6982 Camp St
- 14076 Rucker St
- 14088 Rucker St
- 14082 Rucker St
- 6983 Darling St
- 6983 Darling St
- 14096 Rucker St
- 14058 Rucker St
- 6986 Darling St
- 14113 Rucker St
- 14100 Rucker St
- 14049 Rucker St
- 7019 Darling St
- 14106 Rucker St
- 6974 Base St
- 7026 Camp St
- 14108 Rucker St
- 7027 Darling St