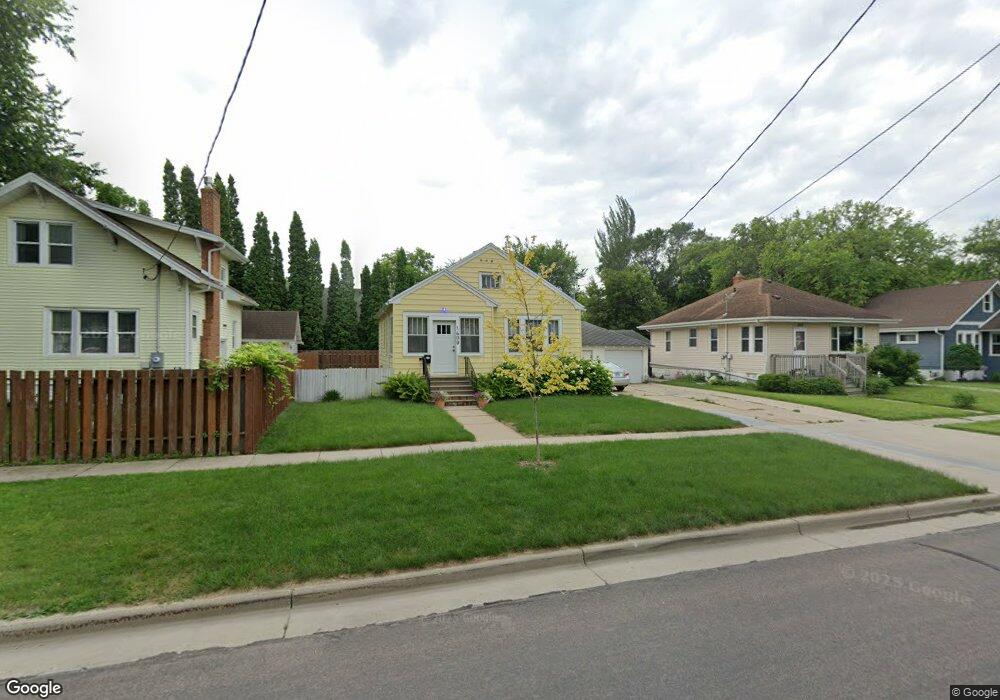
1408 9th Ave S Fargo, ND 58103
Jefferson-Carl NeighborhoodEstimated Value: $180,000 - $198,000
3
Beds
2
Baths
1,650
Sq Ft
$113/Sq Ft
Est. Value
About This Home
This home is located at 1408 9th Ave S, Fargo, ND 58103 and is currently estimated at $186,967, approximately $113 per square foot. 1408 9th Ave S is a home located in Cass County with nearby schools including Clara Barton Elementary School, Carl Ben Eielson Middle School, and South High School.
Ownership History
Date
Name
Owned For
Owner Type
Purchase Details
Closed on
Aug 18, 2017
Sold by
Schmit Brett Mayer and Schmit Kyle
Bought by
Gould Kim M
Current Estimated Value
Home Financials for this Owner
Home Financials are based on the most recent Mortgage that was taken out on this home.
Original Mortgage
$141,383
Outstanding Balance
$117,973
Interest Rate
3.96%
Mortgage Type
New Conventional
Estimated Equity
$68,994
Purchase Details
Closed on
Aug 16, 2013
Sold by
Roberts Jason D
Bought by
Mayer Brett and Mayer Joe
Home Financials for this Owner
Home Financials are based on the most recent Mortgage that was taken out on this home.
Original Mortgage
$73,500
Interest Rate
4.53%
Mortgage Type
New Conventional
Purchase Details
Closed on
Feb 26, 2010
Sold by
Foster Blake O and Foster Elda B
Bought by
Roberts Jason D
Home Financials for this Owner
Home Financials are based on the most recent Mortgage that was taken out on this home.
Original Mortgage
$71,600
Interest Rate
5.11%
Mortgage Type
New Conventional
Create a Home Valuation Report for This Property
The Home Valuation Report is an in-depth analysis detailing your home's value as well as a comparison with similar homes in the area
Home Values in the Area
Average Home Value in this Area
Purchase History
| Date | Buyer | Sale Price | Title Company |
|---|---|---|---|
| Gould Kim M | $140,000 | Plains Title Llc | |
| Mayer Brett | $105,000 | Title Co | |
| Roberts Jason D | -- | -- |
Source: Public Records
Mortgage History
| Date | Status | Borrower | Loan Amount |
|---|---|---|---|
| Open | Gould Kim M | $141,383 | |
| Closed | Mayer Brett | $73,500 | |
| Previous Owner | Roberts Jason D | $71,600 |
Source: Public Records
Tax History
| Year | Tax Paid | Tax Assessment Tax Assessment Total Assessment is a certain percentage of the fair market value that is determined by local assessors to be the total taxable value of land and additions on the property. | Land | Improvement |
|---|---|---|---|---|
| 2024 | $2,139 | $78,100 | $10,950 | $67,150 |
| 2023 | $2,048 | $75,100 | $10,950 | $64,150 |
| 2022 | $2,014 | $72,200 | $10,950 | $61,250 |
| 2021 | $1,728 | $62,800 | $10,950 | $51,850 |
| 2020 | $1,706 | $62,800 | $10,950 | $51,850 |
| 2019 | $1,829 | $66,850 | $6,500 | $60,350 |
| 2018 | $1,791 | $66,850 | $6,500 | $60,350 |
| 2017 | $1,722 | $64,900 | $6,500 | $58,400 |
| 2016 | $1,518 | $63,000 | $6,500 | $56,500 |
| 2015 | $1,515 | $58,950 | $4,450 | $54,500 |
| 2014 | $1,441 | $54,600 | $4,450 | $50,150 |
| 2013 | $1,359 | $52,000 | $4,450 | $47,550 |
Source: Public Records
Map
Nearby Homes
- 1422 8th Ave S
- 1011 14th St S
- 719 15th St S
- 1625 9th Ave S
- 1622 7th Ave S
- 812 10th St S Unit B9
- 804 10th St S Unit A4
- 1329 14th St S
- 1330 14th St S
- 601 10th St S
- 813 17th St S
- 817 9th St S
- 1345 4th Ave S
- 515 10th St S
- 904 18th St S
- 1333 15th St S
- 1301 10th St S
- 1121 4th Ave S
- 911 8th St S
- 1718 6th Ave S
Your Personal Tour Guide
Ask me questions while you tour the home.