Estimated Value: $341,454 - $387,000
3
Beds
2
Baths
1,760
Sq Ft
$211/Sq Ft
Est. Value
About This Home
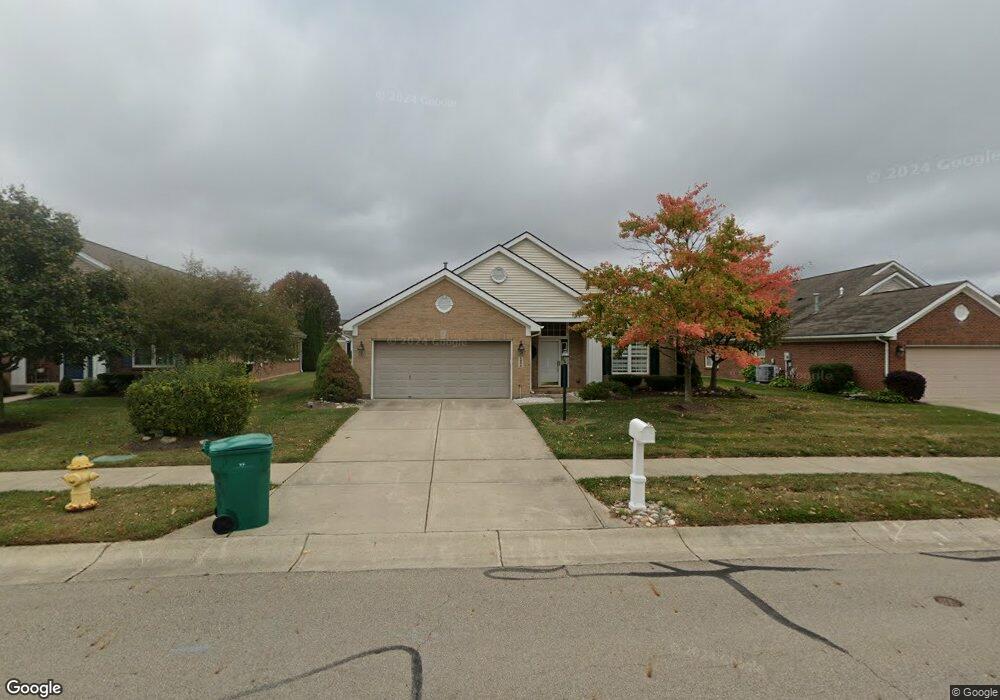
This home is located at 1408 Highland Ln, Xenia, OH 45385 and is currently estimated at $372,114, approximately $211 per square foot. 1408 Highland Ln is a home located in Greene County with nearby schools including Trebein Elementary School, Jacob Coy Middle School, and Beavercreek High School.
Ownership History
Date
Name
Owned For
Owner Type
Purchase Details
Closed on
Jul 17, 2020
Sold by
Ford Charles W and Ford Patricia Ann
Bought by
Salmons Rita L
Current Estimated Value
Home Financials for this Owner
Home Financials are based on the most recent Mortgage that was taken out on this home.
Original Mortgage
$169,900
Outstanding Balance
$150,374
Interest Rate
3%
Mortgage Type
New Conventional
Estimated Equity
$221,740
Purchase Details
Closed on
Sep 28, 2005
Sold by
Simms Sc Ltd
Bought by
Ford Charles W and Ford Patricia Ann
Home Financials for this Owner
Home Financials are based on the most recent Mortgage that was taken out on this home.
Original Mortgage
$60,000
Interest Rate
5.83%
Mortgage Type
Fannie Mae Freddie Mac
Purchase Details
Closed on
May 21, 2002
Sold by
Charles V Simms Development Corp
Bought by
Simms Sc Ltd
Create a Home Valuation Report for This Property
The Home Valuation Report is an in-depth analysis detailing your home's value as well as a comparison with similar homes in the area
Home Values in the Area
Average Home Value in this Area
Purchase History
| Date | Buyer | Sale Price | Title Company |
|---|---|---|---|
| Salmons Rita L | $249,900 | Landmark Title Agency Inc | |
| Ford Charles W | $233,800 | -- | |
| Simms Sc Ltd | -- | -- |
Source: Public Records
Mortgage History
| Date | Status | Borrower | Loan Amount |
|---|---|---|---|
| Open | Salmons Rita L | $169,900 | |
| Previous Owner | Ford Charles W | $60,000 |
Source: Public Records
Tax History Compared to Growth
Tax History
| Year | Tax Paid | Tax Assessment Tax Assessment Total Assessment is a certain percentage of the fair market value that is determined by local assessors to be the total taxable value of land and additions on the property. | Land | Improvement |
|---|---|---|---|---|
| 2024 | $5,432 | $94,580 | $18,500 | $76,080 |
| 2023 | $5,432 | $94,580 | $18,500 | $76,080 |
| 2022 | $4,820 | $73,590 | $18,500 | $55,090 |
| 2021 | $4,869 | $73,590 | $18,500 | $55,090 |
| 2020 | $4,222 | $73,590 | $18,500 | $55,090 |
| 2019 | $3,897 | $63,710 | $16,320 | $47,390 |
| 2018 | $3,397 | $63,710 | $16,320 | $47,390 |
| 2017 | $3,455 | $63,710 | $16,320 | $47,390 |
| 2016 | $3,407 | $63,150 | $16,320 | $46,830 |
| 2015 | $3,429 | $63,150 | $16,320 | $46,830 |
| 2014 | $3,348 | $63,150 | $16,320 | $46,830 |
Source: Public Records
Map
Nearby Homes
- 1462 Champions Way
- 1382 Prestonwood Ct S
- 1247 Homestead Dr
- Torino II Plan at The Courtyards at Stonehill Village
- Palazzo Plan at The Courtyards at Stonehill Village
- Promenade III Plan at The Courtyards at Stonehill Village
- Portico Plan at The Courtyards at Stonehill Village
- Verona Plan at The Courtyards at Stonehill Village
- 1427 Triple Crown Way
- 1590 Windham Ln
- 1121 Westover Rd
- 1589 Stonebury Ct
- 1678 Fairground Rd
- 1416 Hilltop Rd
- 1238 Freedom Point
- 2073 Lincolnshire Dr
- 1481 Stone Ridge Ct
- 1535 Stretch Dr
- 2162 Sulky Trail
- 2331 Eastwind Dr
- 1404 Highland Ln
- 1414 Highland Ln
- 1405 Runnymeade Way
- 1409 Runnymeade Way
- 1424 Highland Ln
- 1398 Highland Ln
- 1413 Runnymeade Way
- 1401 Runnymeade Way
- 1468 Fairhill Ct
- 1467 Fairhill Ct
- 1430 Highland Ln
- 1419 Runnymeade Way
- 1477 Fairhill Ct
- 1425 Runnymeade Way
- 1478 Fairhill Ct
- 1399 Runnymeade Way
- 1436 Highland Ln
- 1390 Highland Ln
- 1469 Dragonwyck Ct
- 1433 Runnymeade Way