1408 Oliver St Weatherford, TX 76086
Estimated Value: $215,435 - $256,000
3
Beds
1
Bath
1,166
Sq Ft
$198/Sq Ft
Est. Value
About This Home
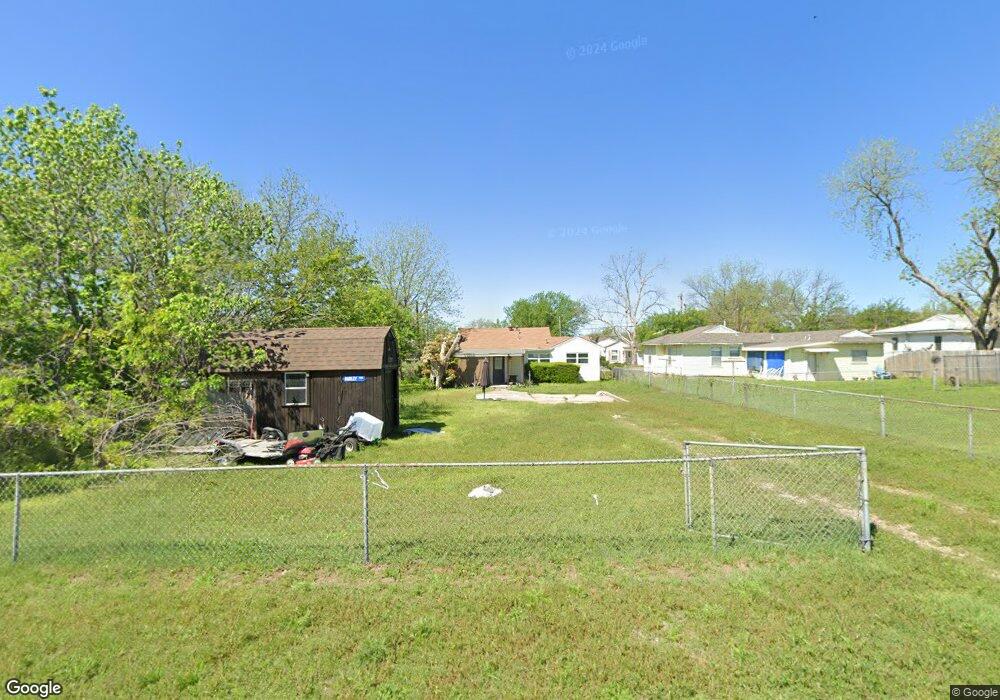
This home is located at 1408 Oliver St, Weatherford, TX 76086 and is currently estimated at $231,109, approximately $198 per square foot. 1408 Oliver St is a home located in Parker County with nearby schools including Seguin Elementary School, Tison Middle School, and Weatherford High School.
Ownership History
Date
Name
Owned For
Owner Type
Purchase Details
Closed on
Jun 3, 2018
Sold by
Mcdnnell Construction & Development Inc
Bought by
Potts Sierra B
Current Estimated Value
Home Financials for this Owner
Home Financials are based on the most recent Mortgage that was taken out on this home.
Original Mortgage
$152,500
Outstanding Balance
$91,728
Interest Rate
4.6%
Mortgage Type
New Conventional
Estimated Equity
$139,381
Purchase Details
Closed on
Jan 24, 2018
Sold by
Nelso Betty
Bought by
Mcdonnell Construction And Development I
Purchase Details
Closed on
Sep 6, 2017
Sold by
Parker Ethel Wonetta Stroud
Bought by
Clay Debra and Stroud Tommy
Purchase Details
Closed on
Aug 21, 2012
Sold by
Parker Ethel Wonetta Stroud
Bought by
Clay Debra and Stroud Tommy
Create a Home Valuation Report for This Property
The Home Valuation Report is an in-depth analysis detailing your home's value as well as a comparison with similar homes in the area
Home Values in the Area
Average Home Value in this Area
Purchase History
| Date | Buyer | Sale Price | Title Company |
|---|---|---|---|
| Potts Sierra B | $152,000 | Capital Title | |
| Mcdonnell Construction And Development I | -- | None Available | |
| Clay Debra | -- | None Available | |
| Clay Debra | -- | None Available |
Source: Public Records
Mortgage History
| Date | Status | Borrower | Loan Amount |
|---|---|---|---|
| Open | Potts Sierra B | $152,500 |
Source: Public Records
Tax History Compared to Growth
Tax History
| Year | Tax Paid | Tax Assessment Tax Assessment Total Assessment is a certain percentage of the fair market value that is determined by local assessors to be the total taxable value of land and additions on the property. | Land | Improvement |
|---|---|---|---|---|
| 2025 | $2,989 | $229,706 | -- | -- |
| 2024 | $2,989 | $208,824 | -- | -- |
| 2023 | $2,989 | $189,840 | $0 | $0 |
| 2022 | $3,828 | $172,590 | $15,000 | $157,590 |
| 2021 | $3,822 | $172,590 | $15,000 | $157,590 |
| 2020 | $3,496 | $144,670 | $15,000 | $129,670 |
| 2019 | $3,694 | $144,670 | $15,000 | $129,670 |
| 2018 | $1,843 | $71,860 | $15,000 | $56,860 |
| 2017 | $1,722 | $71,860 | $15,000 | $56,860 |
| 2016 | $1,566 | $59,510 | $15,000 | $44,510 |
| 2015 | $343 | $59,510 | $15,000 | $44,510 |
| 2014 | $341 | $55,700 | $15,000 | $40,700 |
Source: Public Records
Map
Nearby Homes
- 1406 Oliver St
- 1410 Oliver St
- 1404 Oliver St
- 1412 Oliver St
- 1408 Lexington St
- 1402 Oliver St
- 310 W 5th St
- 1410 Lexington St
- 1407 Oliver St
- 1405 Oliver St
- 1409 Oliver St
- 1416 Oliver St
- 1414 Lexington St
- 1314 Oliver St
- 1403 Oliver St
- 1412 Lexington St
- 1413 Oliver St
- 1401 Oliver St
- 1312 Oliver St
- 1417 Oliver St