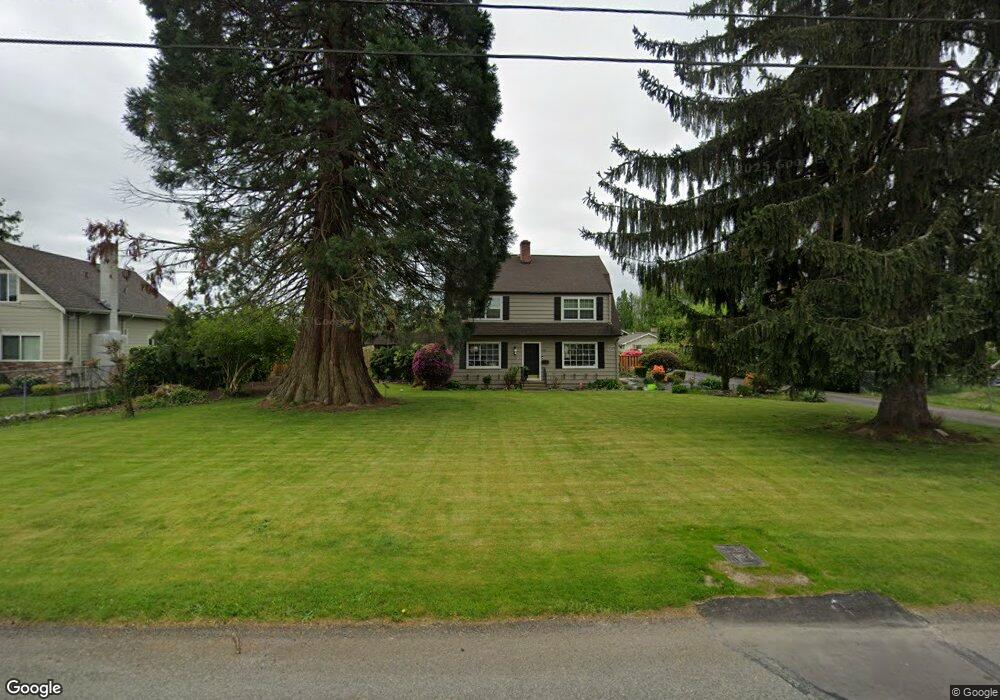
1408 Rainier St Sumner, WA 98390
Estimated Value: $694,000 - $770,000
3
Beds
3
Baths
2,072
Sq Ft
$346/Sq Ft
Est. Value
About This Home
This home is located at 1408 Rainier St, Sumner, WA 98390 and is currently estimated at $717,651, approximately $346 per square foot. 1408 Rainier St is a home located in Pierce County with nearby schools including Maple Lawn Elementary School, Sumner Middle School, and Sumner High School.
Ownership History
Date
Name
Owned For
Owner Type
Purchase Details
Closed on
Jun 25, 2007
Sold by
Kennedy Tim
Bought by
Conklin Steven B and Conklin Jennifer C
Current Estimated Value
Home Financials for this Owner
Home Financials are based on the most recent Mortgage that was taken out on this home.
Original Mortgage
$320,000
Outstanding Balance
$204,241
Interest Rate
7%
Mortgage Type
Purchase Money Mortgage
Estimated Equity
$513,410
Purchase Details
Closed on
Dec 16, 1998
Sold by
Hope Brian R
Bought by
Kennedy Tim
Home Financials for this Owner
Home Financials are based on the most recent Mortgage that was taken out on this home.
Original Mortgage
$188,800
Interest Rate
7.37%
Purchase Details
Closed on
Nov 22, 1996
Sold by
Riebli Richard S and Riebli Georgia L
Bought by
Hope Brian R and Hope Tanya S
Home Financials for this Owner
Home Financials are based on the most recent Mortgage that was taken out on this home.
Original Mortgage
$208,500
Interest Rate
7.5%
Create a Home Valuation Report for This Property
The Home Valuation Report is an in-depth analysis detailing your home's value as well as a comparison with similar homes in the area
Home Values in the Area
Average Home Value in this Area
Purchase History
| Date | Buyer | Sale Price | Title Company |
|---|---|---|---|
| Conklin Steven B | $400,000 | Fidelity National Title Insu | |
| Kennedy Tim | $274,562 | -- | |
| Hope Brian R | $215,000 | Commonwealth Title Company |
Source: Public Records
Mortgage History
| Date | Status | Borrower | Loan Amount |
|---|---|---|---|
| Open | Conklin Steven B | $320,000 | |
| Previous Owner | Kennedy Tim | $188,800 | |
| Previous Owner | Hope Brian R | $208,500 |
Source: Public Records
Tax History
| Year | Tax Paid | Tax Assessment Tax Assessment Total Assessment is a certain percentage of the fair market value that is determined by local assessors to be the total taxable value of land and additions on the property. | Land | Improvement |
|---|---|---|---|---|
| 2025 | $6,148 | $637,900 | $286,500 | $351,400 |
| 2024 | $6,148 | $640,100 | $275,300 | $364,800 |
| 2023 | $6,148 | $594,300 | $275,300 | $319,000 |
| 2022 | $6,166 | $606,600 | $302,200 | $304,400 |
| 2021 | $5,888 | $446,700 | $184,700 | $262,000 |
| 2019 | $4,896 | $427,900 | $162,100 | $265,800 |
| 2018 | $5,089 | $392,100 | $139,200 | $252,900 |
| 2017 | $4,187 | $359,700 | $114,700 | $245,000 |
| 2016 | $3,431 | $278,700 | $81,800 | $196,900 |
| 2014 | $3,137 | $257,700 | $85,700 | $172,000 |
| 2013 | $3,137 | $231,500 | $78,000 | $153,500 |
Source: Public Records
Map
Nearby Homes
- 414 Sumner Ave
- 520 Sumner Ave Unit 524
- 1825 Rainier Ct
- 328 Cherry Ave
- 14003 70th St E
- 14002 70th Street Ct E
- 611 Mckinnon Ave
- 0 Narrow St Unit NWM1946803
- 610 Mckinnon Ave
- 7503 Village Dr
- 637 Elizabeth St
- 612 Hunt Ave
- 7608 145th Avenue Ct E Unit 30
- 14925 Rivergrove Dr E
- 510 State St
- 1313 Washington St
- 1412 Everett St
- 1319 Wood Ave
- 1416 Mcmillan Ave Unit B1
- 14619 80th St E
Your Personal Tour Guide
Ask me questions while you tour the home.