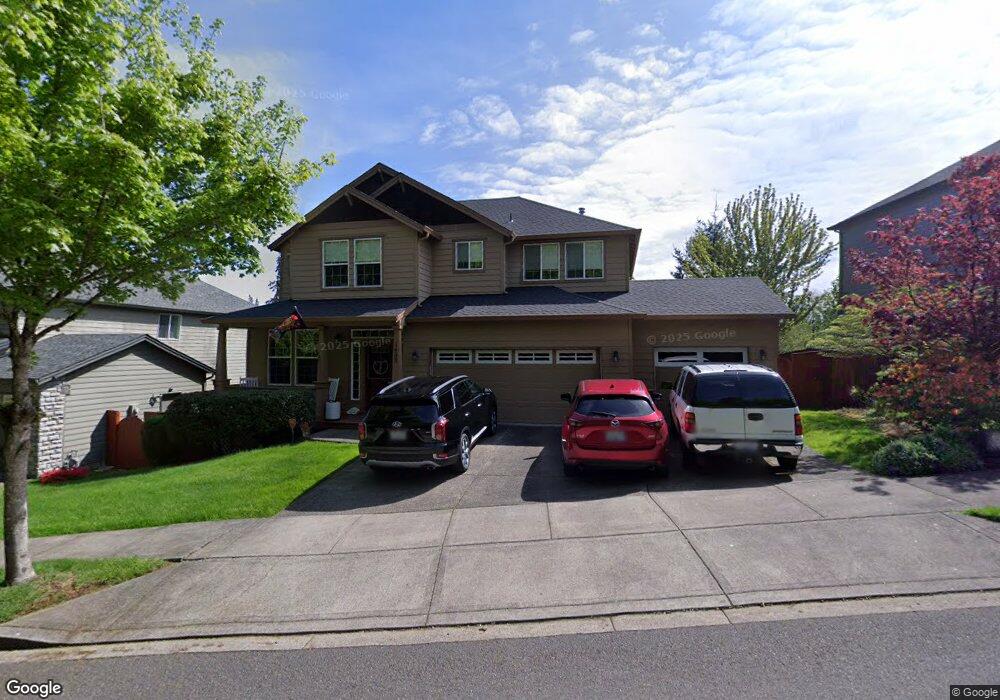
1408 S 21st Place Ridgefield, WA 98642
Estimated Value: $637,631 - $731,000
4
Beds
3
Baths
2,173
Sq Ft
$320/Sq Ft
Est. Value
About This Home
This home is located at 1408 S 21st Place, Ridgefield, WA 98642 and is currently estimated at $695,908, approximately $320 per square foot. 1408 S 21st Place is a home located in Clark County with nearby schools including Ridgefield High School.
Ownership History
Date
Name
Owned For
Owner Type
Purchase Details
Closed on
Jan 13, 2014
Sold by
Johnson Brian T and Johnson Angel M
Bought by
Anderson Andreas A
Current Estimated Value
Purchase Details
Closed on
Mar 2, 2011
Sold by
Fannie Mae
Bought by
Johnson Brian T and Johnson Angel M
Home Financials for this Owner
Home Financials are based on the most recent Mortgage that was taken out on this home.
Original Mortgage
$254,870
Interest Rate
4.75%
Mortgage Type
FHA
Purchase Details
Closed on
Dec 15, 2010
Sold by
Green Lynda J
Bought by
Federal National Mortgage Association
Purchase Details
Closed on
Aug 1, 2007
Sold by
Osprey Pointe Inc
Bought by
Green Lynda J
Home Financials for this Owner
Home Financials are based on the most recent Mortgage that was taken out on this home.
Original Mortgage
$283,820
Interest Rate
6.66%
Mortgage Type
Purchase Money Mortgage
Create a Home Valuation Report for This Property
The Home Valuation Report is an in-depth analysis detailing your home's value as well as a comparison with similar homes in the area
Home Values in the Area
Average Home Value in this Area
Purchase History
| Date | Buyer | Sale Price | Title Company |
|---|---|---|---|
| Anderson Andreas A | $285,000 | Fidelity National Title | |
| Johnson Brian T | $261,500 | Chicago Title Insurance Co | |
| Federal National Mortgage Association | $318,087 | None Available | |
| Green Lynda J | $354,775 | Chicago Title Insurance |
Source: Public Records
Mortgage History
| Date | Status | Borrower | Loan Amount |
|---|---|---|---|
| Previous Owner | Johnson Brian T | $254,870 | |
| Previous Owner | Green Lynda J | $283,820 |
Source: Public Records
Tax History Compared to Growth
Tax History
| Year | Tax Paid | Tax Assessment Tax Assessment Total Assessment is a certain percentage of the fair market value that is determined by local assessors to be the total taxable value of land and additions on the property. | Land | Improvement |
|---|---|---|---|---|
| 2025 | $4,821 | $547,297 | $155,000 | $392,297 |
| 2024 | $4,455 | $541,461 | $155,000 | $386,461 |
| 2023 | $4,077 | $535,703 | $155,000 | $380,703 |
| 2022 | $3,984 | $469,199 | $126,225 | $342,974 |
| 2021 | $3,899 | $428,986 | $123,750 | $305,236 |
| 2020 | $3,697 | $392,700 | $115,500 | $277,200 |
| 2019 | $3,572 | $367,320 | $104,775 | $262,545 |
| 2018 | $3,894 | $358,533 | $0 | $0 |
| 2017 | $3,141 | $337,456 | $0 | $0 |
| 2016 | $3,095 | $321,558 | $0 | $0 |
| 2015 | $3,123 | $303,706 | $0 | $0 |
| 2014 | -- | $293,303 | $0 | $0 |
| 2013 | -- | $264,557 | $0 | $0 |
Source: Public Records
Map
Nearby Homes
- 1410 S 21st Place
- 1910 S 15th Cir
- 1925 S Osprey Dr
- 1810 S Dusky Dr
- 2108 S 19th Way
- 745 S 21st Place
- 2213 S 19th Way
- 2601 S 8th Way
- 2605 S 8th Way
- 1761 S 18th Cir
- 6937 N Madison Cir
- 701 S 26th Place
- 625 S 26th Place
- 701 26th Place
- 717 S 26th Place
- 2605 S 7th Way
- 2609 S 7th Way
- 2610 S 7th Way
- 2604 S 8th Way
- 2608 S 8th Way
- 1406 S 21st Place
- 2209 S 13th Cir
- 2209 S 13th Cir Unit 19
- 1500 S 21st Place
- 2211 S 13th Cir Unit 20
- 1502 S 21st Place
- 2158 S 13th Cir
- 1504 S 21st Place
- 2215 S 13th Cir
- 1506 S 21st Place
- 2132 S 13th Cir
- 2112 S 13th Cir
- 2080 S 13th Cir
- 1508 S 21st Place
- 1916 S 15th Cir
- 2131 S Osprey Dr
- 2128 S Osprey Dr
- 1918 S 15th Cir
- 2129 S Osprey Dr
- 1915 S 15th Cir