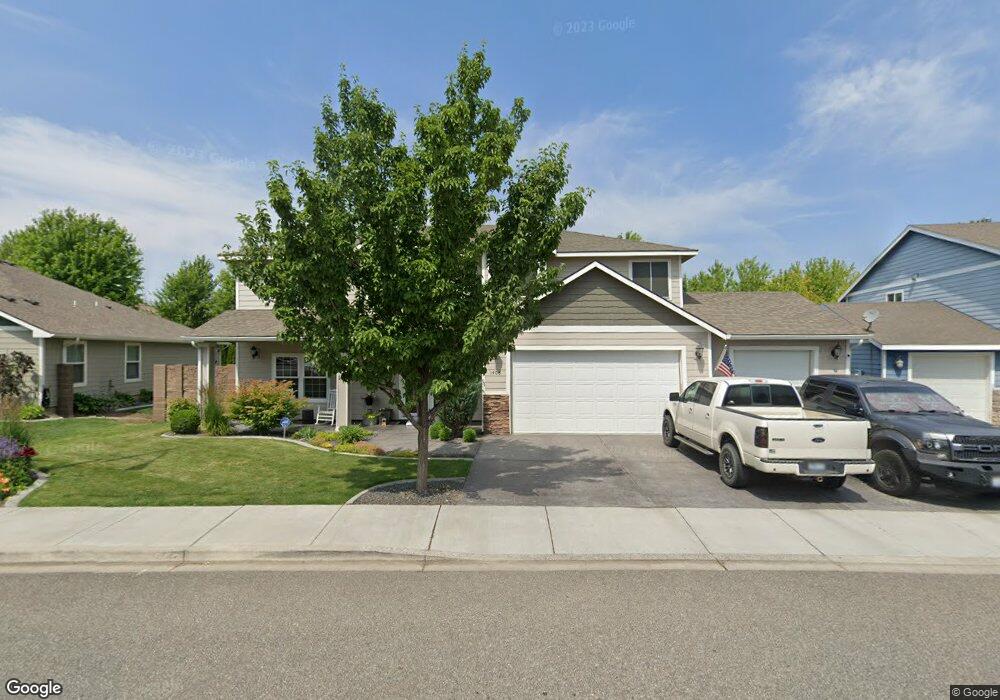
1408 S Harrison St Kennewick, WA 99338
Estimated Value: $581,956 - $626,000
4
Beds
3
Baths
3,039
Sq Ft
$198/Sq Ft
Est. Value
About This Home
This home is located at 1408 S Harrison St, Kennewick, WA 99338 and is currently estimated at $600,739, approximately $197 per square foot. 1408 S Harrison St is a home located in Benton County with nearby schools including Ridge View Elementary School and Southridge High School.
Ownership History
Date
Name
Owned For
Owner Type
Purchase Details
Closed on
May 2, 2018
Sold by
Bertrand Eric P and Bertrand Ching Ru
Bought by
Lamb Dustin E and Lamb Kara E
Current Estimated Value
Home Financials for this Owner
Home Financials are based on the most recent Mortgage that was taken out on this home.
Original Mortgage
$360,905
Outstanding Balance
$311,109
Interest Rate
4.45%
Mortgage Type
New Conventional
Estimated Equity
$289,630
Purchase Details
Closed on
Jun 10, 2010
Sold by
Lq Construction Llc
Bought by
Bertrand Eric P and Bertrand Ching Ru
Home Financials for this Owner
Home Financials are based on the most recent Mortgage that was taken out on this home.
Original Mortgage
$281,187
Interest Rate
5.5%
Mortgage Type
FHA
Purchase Details
Closed on
Jan 12, 2010
Sold by
Nnp Creekstone Llc
Bought by
Lq Construction Llc
Home Financials for this Owner
Home Financials are based on the most recent Mortgage that was taken out on this home.
Original Mortgage
$228,000
Interest Rate
4.91%
Mortgage Type
Construction
Create a Home Valuation Report for This Property
The Home Valuation Report is an in-depth analysis detailing your home's value as well as a comparison with similar homes in the area
Home Values in the Area
Average Home Value in this Area
Purchase History
| Date | Buyer | Sale Price | Title Company |
|---|---|---|---|
| Lamb Dustin E | $379,900 | Ticor Title Co | |
| Bertrand Eric P | $285,000 | Benton Franklin Title Co | |
| Lq Construction Llc | $42,000 | Frontier Title & Escrow Co |
Source: Public Records
Mortgage History
| Date | Status | Borrower | Loan Amount |
|---|---|---|---|
| Open | Lamb Dustin E | $360,905 | |
| Previous Owner | Bertrand Eric P | $281,187 | |
| Previous Owner | Lq Construction Llc | $228,000 |
Source: Public Records
Tax History Compared to Growth
Tax History
| Year | Tax Paid | Tax Assessment Tax Assessment Total Assessment is a certain percentage of the fair market value that is determined by local assessors to be the total taxable value of land and additions on the property. | Land | Improvement |
|---|---|---|---|---|
| 2024 | $4,519 | $535,760 | $70,000 | $465,760 |
| 2023 | $4,519 | $567,880 | $70,000 | $497,880 |
| 2022 | $3,812 | $439,390 | $70,000 | $369,390 |
| 2021 | $3,628 | $391,210 | $70,000 | $321,210 |
| 2020 | $3,557 | $360,870 | $46,000 | $314,870 |
| 2019 | $3,248 | $338,380 | $46,000 | $292,380 |
| 2018 | $3,405 | $315,890 | $46,000 | $269,890 |
| 2017 | $3,130 | $270,910 | $46,000 | $224,910 |
| 2016 | $3,576 | $270,910 | $46,000 | $224,910 |
| 2015 | $3,541 | $270,910 | $46,000 | $224,910 |
| 2014 | -- | $266,660 | $42,000 | $224,660 |
| 2013 | -- | $266,660 | $42,000 | $224,660 |
Source: Public Records
Map
Nearby Homes
- 5605 W 14th Ave
- 5603 W 15th Ave
- 1602 S Fillmore St
- 1603 S Fillmore St
- 5926 W 16th Ave
- 1705 S Edison St
- 5805 W 19th Ave
- Lot 12, Phase 8 W 20th Ave Unit Lot12
- Lot 11, Phase 8 W 20th Ave Unit Lot11
- Lot 8, Phase 8 W 20th Ave Unit Lot 8
- Lot 7, Phase 8 W 20th Ave Unit Lot 7
- 1911 S Edison St
- 1102 S Lincoln St
- 5702 W 23rd Ave
- 800 S Jefferson St Unit Lot 1
- 5404 W 8th Ave
- 5304 W 8th Ave
- 6109 W 8th Ave
- 6050 W 20th Ave
- 1916 S Buchanan St
- 1404 S Harrison St
- 1410 S Harrison St
- 1412 S Harrison St
- 1400 S Harrison St
- 5706 W 15th Ave
- 1407 S Harrison St
- 1411 S Harrison St
- 1503 S Irving Place
- 1509 S Irving Place
- 1413 S Harrison St Unit AMAZING HOME -A MUST
- 1413 S Harrison St Unit Master Down with Ple
- 1413 S Harrison St Unit Beautiful 2 Story w/
- 1413 S Harrison St
- 5705 W 14th Ave
- 5701 W 14th Ave
- 1414 S Harrison St
- 5710 W 15th Ave
- 1513 S Irving Place
- 5613 W 14th Ave Unit SHORT SALE. LOOK AT
- 5613 W 14th Ave Unit CREEKSTONE BEAUTY