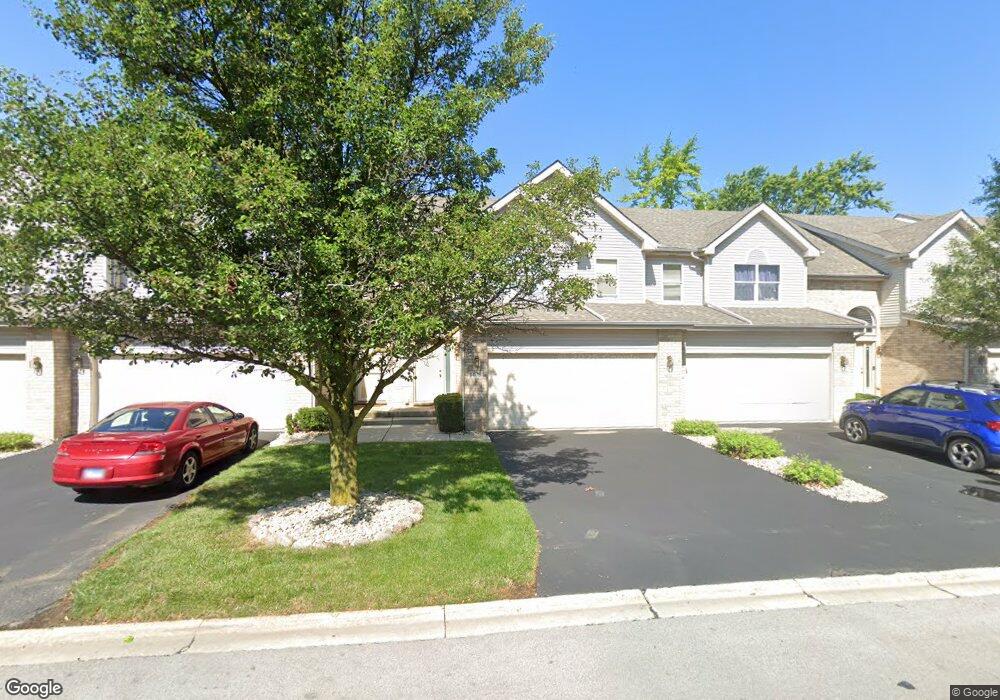
1408 Williams St Flossmoor, IL 60422
Estimated Value: $277,552 - $285,000
2
Beds
3
Baths
1,883
Sq Ft
$149/Sq Ft
Est. Value
About This Home
This home is located at 1408 Williams St, Flossmoor, IL 60422 and is currently estimated at $280,388, approximately $148 per square foot. 1408 Williams St is a home located in Cook County with nearby schools including Heather Hill Elementary School, Parker Junior High School, and Homewood-Flossmoor High School.
Ownership History
Date
Name
Owned For
Owner Type
Purchase Details
Closed on
Aug 8, 2020
Sold by
Sams Cornelius
Bought by
Sams Cornelius and Sams Artese
Current Estimated Value
Purchase Details
Closed on
Nov 4, 2005
Sold by
7209 Roosevelt Llc
Bought by
Sams Cornelius
Home Financials for this Owner
Home Financials are based on the most recent Mortgage that was taken out on this home.
Original Mortgage
$183,900
Outstanding Balance
$110,116
Interest Rate
7.6%
Mortgage Type
Unknown
Estimated Equity
$170,272
Purchase Details
Closed on
Apr 28, 2003
Sold by
K & L Flossmoor Llc
Bought by
7209 Roosevelt Llc
Home Financials for this Owner
Home Financials are based on the most recent Mortgage that was taken out on this home.
Original Mortgage
$121,400
Interest Rate
6.25%
Create a Home Valuation Report for This Property
The Home Valuation Report is an in-depth analysis detailing your home's value as well as a comparison with similar homes in the area
Home Values in the Area
Average Home Value in this Area
Purchase History
| Date | Buyer | Sale Price | Title Company |
|---|---|---|---|
| Sams Cornelius | -- | None Available | |
| Sams Cornelius | $230,000 | Chicago Title Insurance Comp | |
| Sams Cornelius | $230,000 | Chicago Title Insurance Comp | |
| 7209 Roosevelt Llc | $171,500 | Mtc | |
| 7209 Roosevelt Llc | $171,500 | Mtc |
Source: Public Records
Mortgage History
| Date | Status | Borrower | Loan Amount |
|---|---|---|---|
| Open | Sams Cornelius | $183,900 | |
| Closed | Sams Cornelius | $183,900 | |
| Previous Owner | 7209 Roosevelt Llc | $121,400 |
Source: Public Records
Tax History Compared to Growth
Tax History
| Year | Tax Paid | Tax Assessment Tax Assessment Total Assessment is a certain percentage of the fair market value that is determined by local assessors to be the total taxable value of land and additions on the property. | Land | Improvement |
|---|---|---|---|---|
| 2024 | $8,096 | $23,000 | $3,947 | $19,053 |
| 2023 | $5,780 | $23,000 | $3,947 | $19,053 |
| 2022 | $5,780 | $14,852 | $3,406 | $11,446 |
| 2021 | $5,848 | $14,850 | $3,405 | $11,445 |
| 2020 | $5,744 | $14,850 | $3,405 | $11,445 |
| 2019 | $7,133 | $16,666 | $3,096 | $13,570 |
| 2018 | $6,862 | $16,666 | $3,096 | $13,570 |
| 2017 | $6,768 | $16,666 | $3,096 | $13,570 |
| 2016 | $5,688 | $13,237 | $2,786 | $10,451 |
| 2015 | $6,389 | $14,629 | $2,786 | $11,843 |
| 2014 | $6,297 | $14,629 | $2,786 | $11,843 |
| 2013 | $6,687 | $16,626 | $2,786 | $13,840 |
Source: Public Records
Map
Nearby Homes
- 3232 Chestnut Dr
- 3045 Scott Crescent
- 3533 Flossmoor Rd
- 3118 Elaine Ct Unit 232
- 3013 Mac Heath Crescent
- 3427 Vollmer Rd Unit 209
- 3037 Candlewood Ct
- 19020 Kedzie Ave
- 1034 Central Park Ave
- 3415 Vollmer Rd Unit 308
- 2937 Kathleen Ln
- 3521 Park Place
- 3845 192nd St
- 1402 Berry Ln
- 3907 Troon St
- 2931 Sunset Ave
- 1248 Berry Ln
- 2929 Flossmoor Rd
- 1833 Pheasant Ct
- 1248 Oakmont Ave
- 1406 Williams St
- 1410 Williams St
- 1410 Williams St Unit 3
- 1410 Williams St Unit 1410
- 1404 Williams St
- 1412 Williams St
- 1402 Williams St Unit 1402
- 1416 Williams St Unit 3
- 1418 Williams St Unit 3
- 1407 Williams St
- 1405 Williams St
- 1409 Williams St Unit 3
- 1403 Williams St
- 1420 Williams St Unit 3
- 1401 Williams St
- 1415 Williams St
- 1422 Williams St
- 1417 Williams St Unit 3
- 1424 Williams St Unit 1424