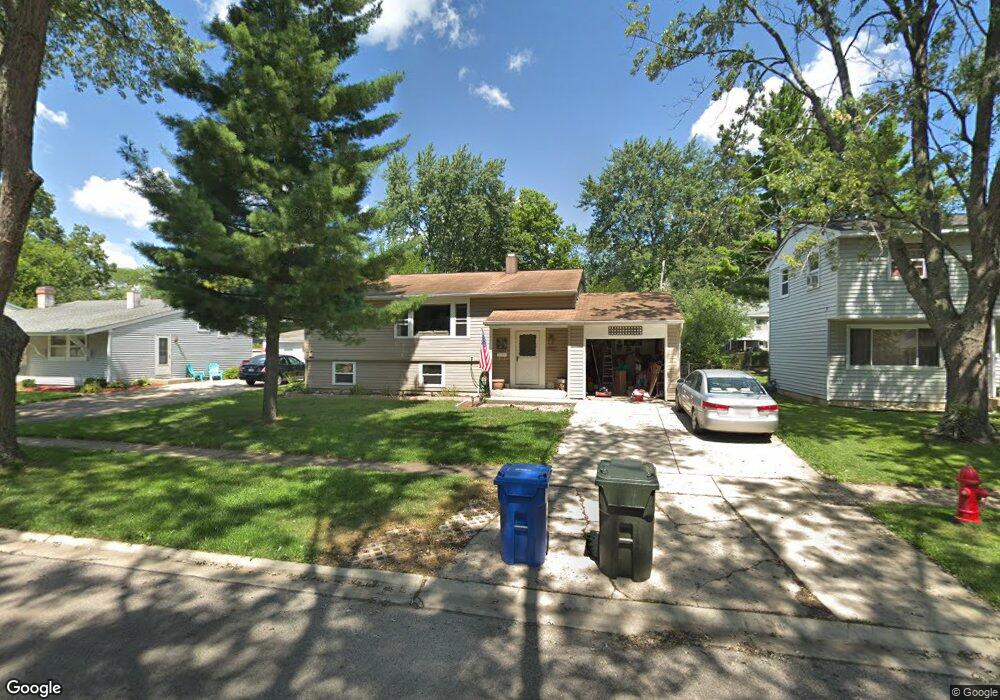
1408 Windsor Cir Carpentersville, IL 60110
Estimated Value: $272,330 - $288,000
3
Beds
--
Bath
1,976
Sq Ft
$142/Sq Ft
Est. Value
About This Home
This home is located at 1408 Windsor Cir, Carpentersville, IL 60110 and is currently estimated at $279,833, approximately $141 per square foot. 1408 Windsor Cir is a home located in Kane County with nearby schools including Golfview Elementary School, Carpentersville Middle School, and Dundee-Crown High School.
Ownership History
Date
Name
Owned For
Owner Type
Purchase Details
Closed on
Mar 19, 1995
Sold by
Webb Gary A
Bought by
Schmidt James L and Schmidt Cynthia A
Current Estimated Value
Home Financials for this Owner
Home Financials are based on the most recent Mortgage that was taken out on this home.
Original Mortgage
$48,000
Interest Rate
8.42%
Purchase Details
Closed on
Mar 17, 1995
Sold by
Webb Kathleen M and Webb Gary A
Bought by
Schmidt James L and Schmidt Cynthia A
Home Financials for this Owner
Home Financials are based on the most recent Mortgage that was taken out on this home.
Original Mortgage
$48,000
Interest Rate
8.42%
Purchase Details
Closed on
Mar 15, 1995
Sold by
Webb Scott E and Schmidt Cynthia A
Bought by
Schmidt James L and Schmidt Cynthia A
Home Financials for this Owner
Home Financials are based on the most recent Mortgage that was taken out on this home.
Original Mortgage
$48,000
Interest Rate
8.42%
Create a Home Valuation Report for This Property
The Home Valuation Report is an in-depth analysis detailing your home's value as well as a comparison with similar homes in the area
Home Values in the Area
Average Home Value in this Area
Purchase History
| Date | Buyer | Sale Price | Title Company |
|---|---|---|---|
| Schmidt James L | $12,000 | -- | |
| Schmidt James L | $12,000 | -- | |
| Schmidt James L | $12,000 | -- |
Source: Public Records
Mortgage History
| Date | Status | Borrower | Loan Amount |
|---|---|---|---|
| Closed | Schmidt James L | $48,000 |
Source: Public Records
Tax History Compared to Growth
Tax History
| Year | Tax Paid | Tax Assessment Tax Assessment Total Assessment is a certain percentage of the fair market value that is determined by local assessors to be the total taxable value of land and additions on the property. | Land | Improvement |
|---|---|---|---|---|
| 2024 | $5,151 | $76,021 | $12,553 | $63,468 |
| 2023 | $5,075 | $68,401 | $11,295 | $57,106 |
| 2022 | $5,200 | $65,719 | $11,295 | $54,424 |
| 2021 | $5,078 | $62,052 | $10,665 | $51,387 |
| 2020 | $4,993 | $60,657 | $10,425 | $50,232 |
| 2019 | $4,881 | $57,583 | $9,897 | $47,686 |
| 2018 | $4,660 | $52,960 | $9,701 | $43,259 |
| 2017 | $4,466 | $49,542 | $9,075 | $40,467 |
| 2016 | $4,081 | $43,096 | $8,787 | $34,309 |
| 2015 | -- | $34,103 | $8,234 | $25,869 |
| 2014 | -- | $30,467 | $8,007 | $22,460 |
| 2013 | -- | $31,399 | $8,252 | $23,147 |
Source: Public Records
Map
Nearby Homes
- 1423 Windsor Cir
- 1505 Plymouth Cir
- 1000 Adams Ct
- 901 Garfield Dr
- 25 Rolling Hills Dr
- 51 Golfview Ln
- 512 Tyler Dr
- 2021 Berkshire Cir Unit B
- 7 Hickory Dr
- 57 Robin Rd
- 34 Hickory Dr
- 160J Bateman Rd
- 1105 Denver Dr
- 225 Westfield Way
- 4 Austin Ave
- 7 Austin Ave
- 1415 Plainview Rd
- 730 Council Hill Rd
- 336 Delaware St
- 827 Balmoral Dr